


Using MACD Double Bull Crossover to Predict Market Reversals: A Data-Driven Study
The Moving Average Convergence Divergence (MACD) indicator is a cornerstone of technical analysis, prized for its ability to signal potential trend changes. One particularly popular MACD strategy focuses on the "double bull crossover," where the MACD line crosses above the signal line for the second time. But how effective is this strategy at predicting true market reversals? In this data-driven study, we'll delve into the historical performance of the double bull crossover, analyzing its accuracy and exploring how to optimize its use for informed trading decisions.
What is MACD?
MACD, which stands for Moving Average Convergence Divergence, is a technical analysis indicator used by traders to understand momentum, potential trend changes, and identify possible entry and exit points in the market. It analyzes the relationship between two moving averages of a security's price to understand the strength and direction of a trend.
MACD Breakdown
The MACD consists of three key elements:
MACD Line: This is the difference between two Exponential Moving Averages (EMAs) of an asset's price. A common setup uses a 12-day EMA for faster price movement and a 26-day EMA for slower movement.
Signal Line: This is a moving average (often a 9-day EMA) of the MACD line itself, smoothing out fluctuations and providing a directional signal.
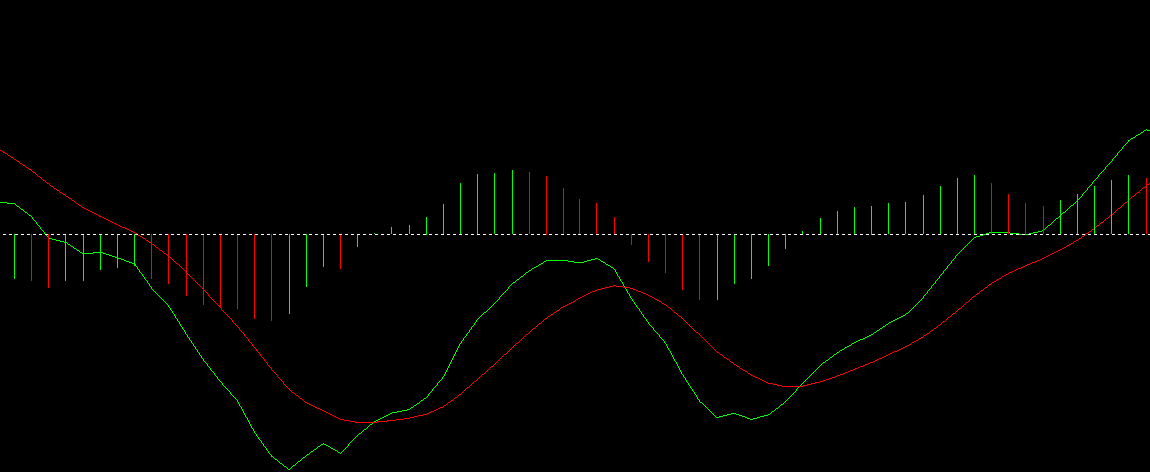
Histogram: The histogram represents the difference between the MACD line and the signal line. It visually portrays the relationship between the two EMAs.
Interpreting the MACD:
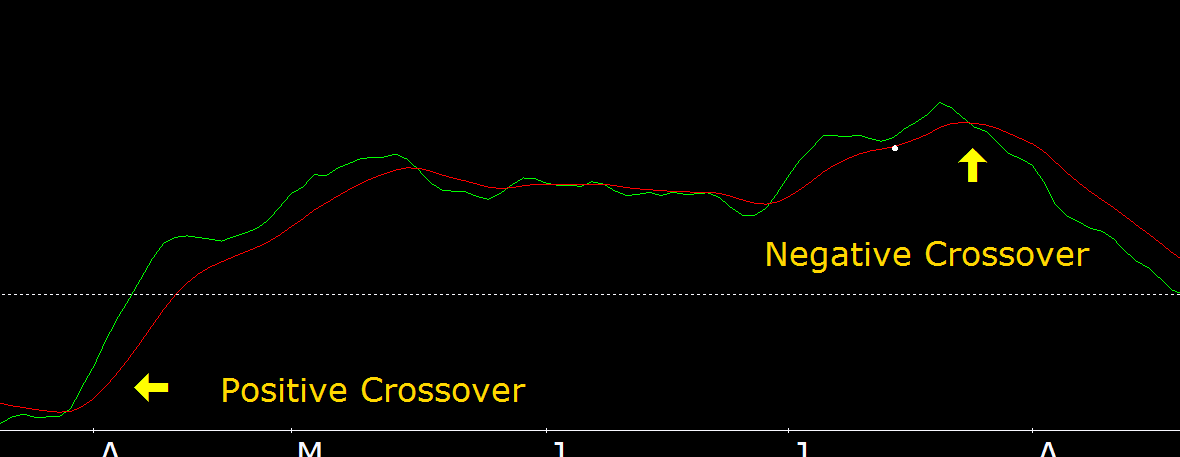
Crossovers: When the MACD line crosses above the signal line, it's a bullish crossover, suggesting a potential trend shift upwards. Conversely, a bearish crossover occurs when the MACD line falls below the signal line, indicating a possible downtrend.
Divergence: When the price and the MACD line move in opposite directions, it's called divergence. This can be a sign of weakening momentum and a potential trend reversal. Bullish divergence occurs when the price makes lower lows but the MACD makes higher lows, and vice versa for bearish divergence.
Histogram: The histogram's height reflects the strength of the trend. A rising histogram indicates increasing momentum, while a falling histogram suggests weakening momentum. Additionally, the histogram crossing above or below zero can signal potential trend changes.
Beyond the Basics:
MACD with Volume: Combining MACD with volume analysis can strengthen signals. Higher volume on a crossover or divergence can increase the signal's confidence.
Multiple Timeframes: Analyzing the MACD on different timeframes (daily, weekly, monthly) can provide a broader perspective on the trend and potential entry/exit points.
Customizing Parameters: The standard 12-26-9 settings are a starting point. Experimenting with different EMA lengths can tailor the MACD to specific markets or trading styles.
MACD Double bull crossover
MACD double bull crossover is a special trading strategy I have discover it during 2008-2009. I am damn sure that it is institutional trader's secret strategy. Let me discuss it in details.
In any charting softwere we have two lines, green line is called MACD line where red line is called Signal line, I have observed few pattern in this two line.
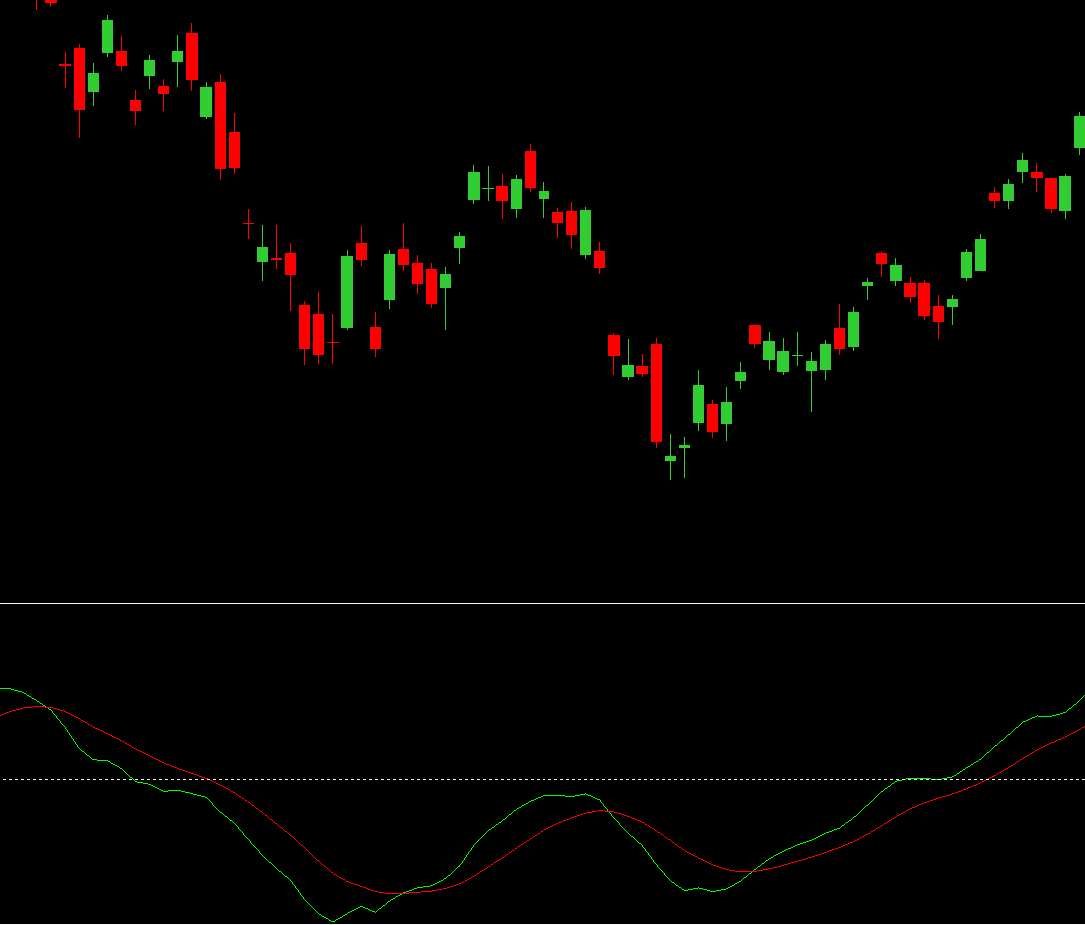
Firstly, when price is in bearish trend, both the MACD line and signal line plotted below the zero line in chart, and when MACD line overlap the signal line for the first time while both are bellow the zero line is a signal of trend reversal. But if you act on first time crossover, trade may or may not become successfull. But it is giving you the indication about price reversal. Trading on first positive crossover requires an additional confirmation. By the way, when MACD line crosses over the signal line for the second time after a few days then it gives an extra edge to the investor. It is a clear signal of of price reversal.
Remember The second bull crossover must occur at higher high area to get the momentum and perfect reversal.
Secondly, we shall check the manner of second crossover, it is important. Second crossover may occur in bearish territory or combiningly in bearish and bullish territory or in bullish territory, no matter where it is going to occur, but impact is excellent in trading.
Double Bull Cross At Bullish Territory
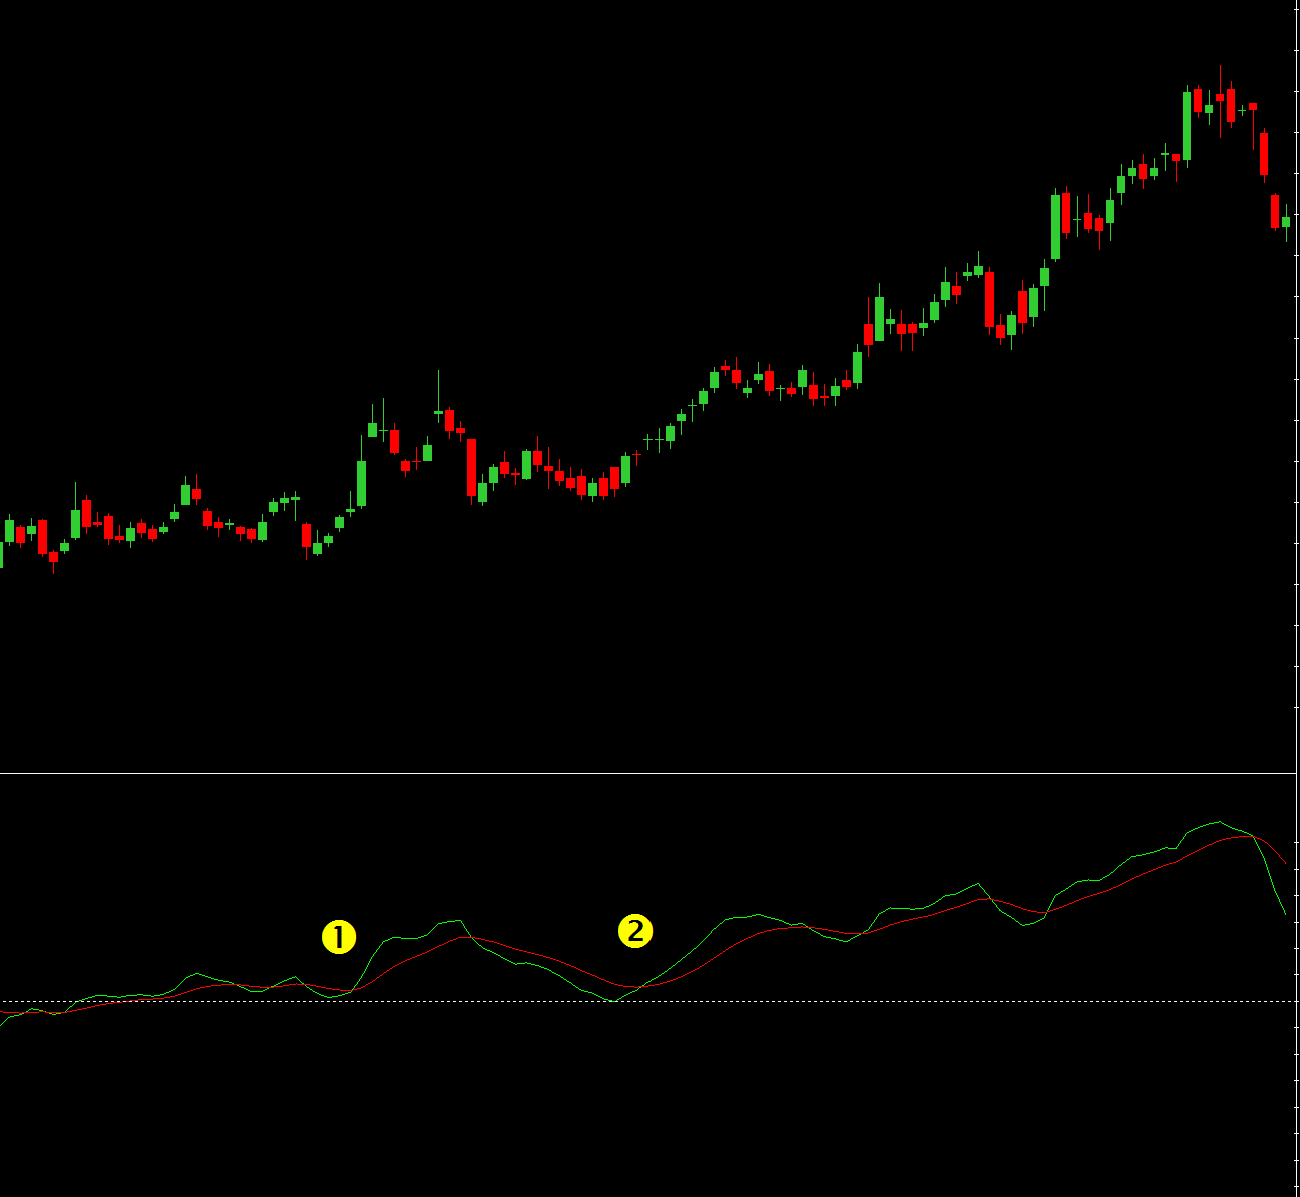
Carefully check the left side picture, this is also another study of MACD which gives you continuation signal.
While price is in up trend, MACD also above th ezero line and if it gives second time positive crossover at higher low area of MACD is also called double bull crossover of MACD
It reffers the continuation of up trend.
Double Bull Cross In bearish territory (MACD Divergence)
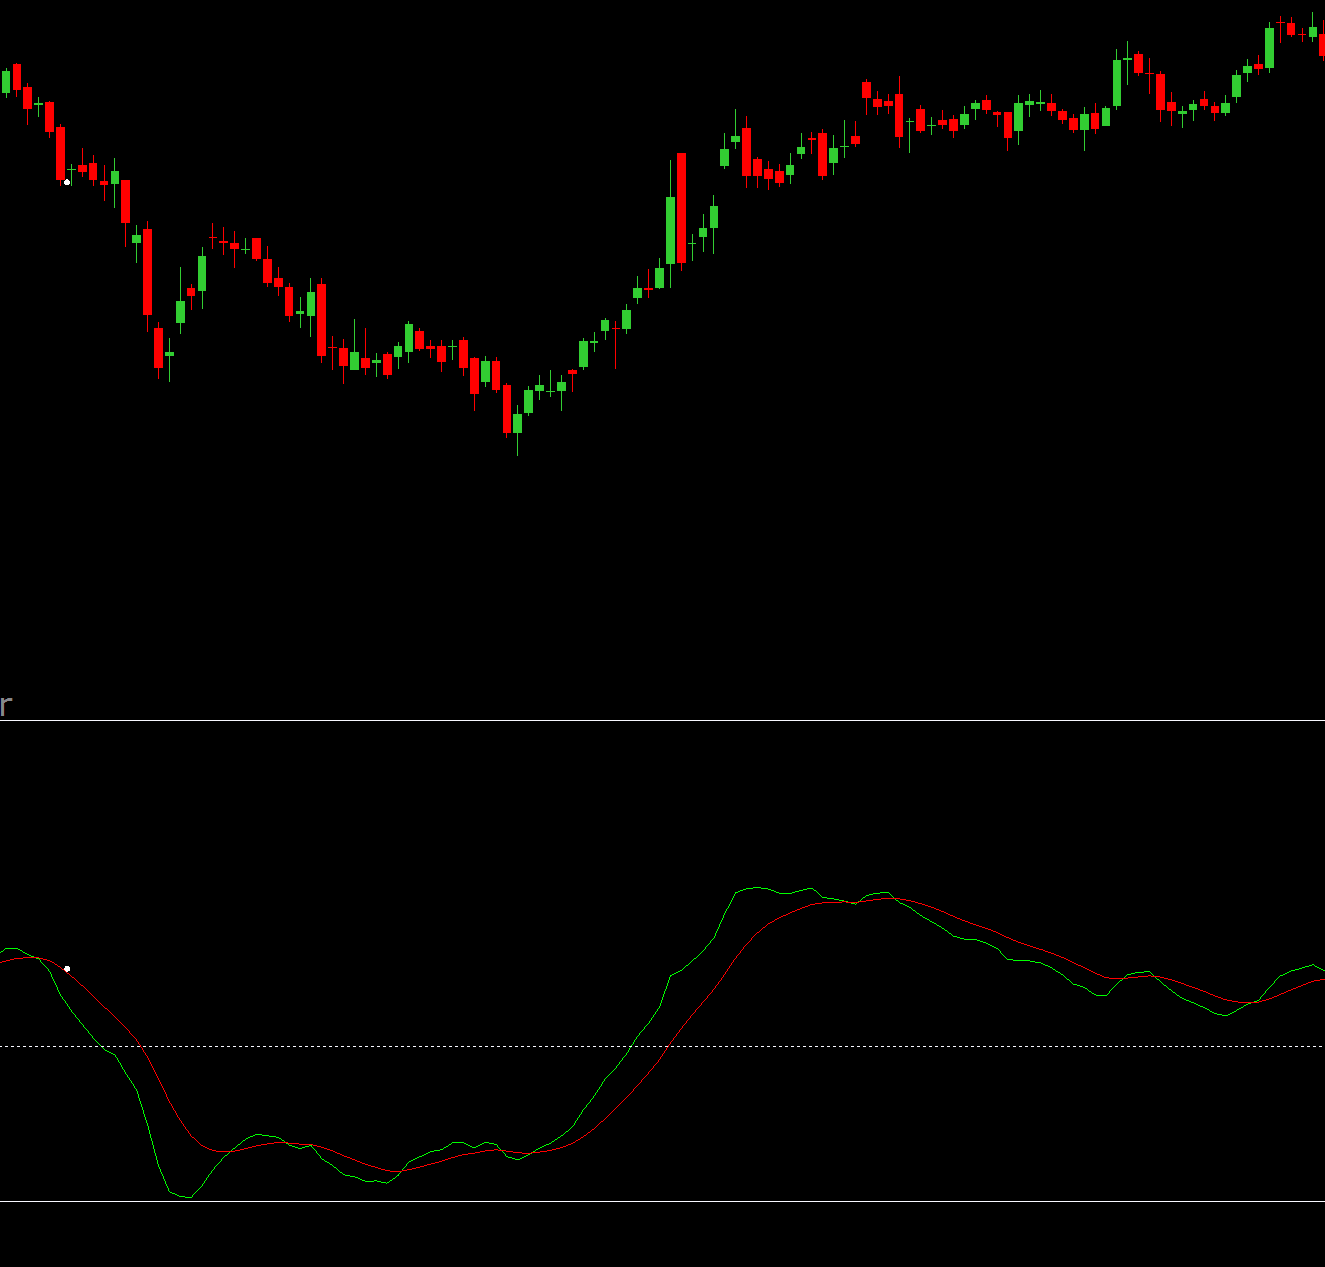
Check the right side picture, this is also another MACD double bull crossover, which generate reversal signal.
While price in in down trend and making lower lower low, during the time MACD making lower high is called MACD positive divergence. And once the MACD line crosses the signal line, then the divergence confirmed the reversal.
As MACD is lagging indicator, the divergence or double bull crossover is an unique technical scenario for long trade.
Double bull crossover in mixed territory
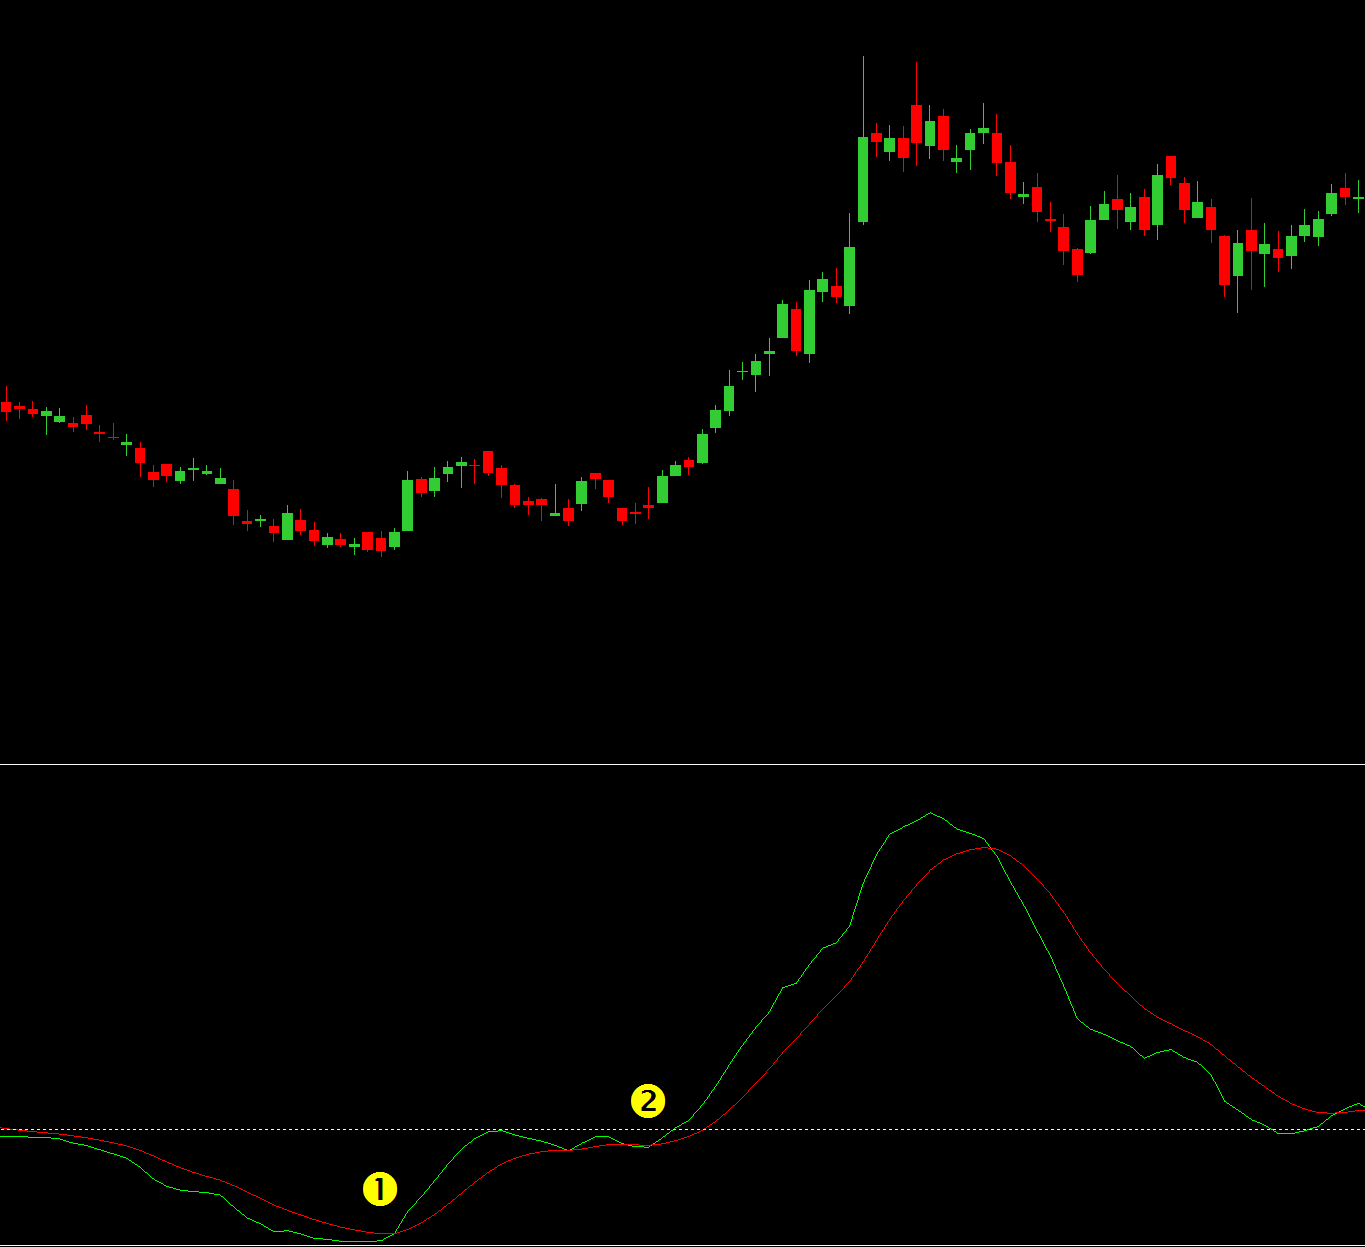
Check the picture left side, normally this formation occur after a significant down trend.
First, while MACD gives a possitive crossover below the zero line, price starts moving up, in the mean time if both, MACD and signal line crosses above the zero line price enter into bullish territory. Normally it happens when price moves above the zero line with big volume and big green candle, afetr a few days up move if price starts moving sideways then MACD crosses the signal line in bullish territory, then price starts move faster.
This is one of the best trading strategy.
Beyond the Basics:
MACD with Volume: Combining MACD with volume analysis can strengthen signals. Higher volume on a crossover or divergence can increase the signal's confidence.
Multiple Timeframes: Analyzing the MACD on different timeframes (daily, weekly, monthly) can provide a broader perspective on the trend and potential entry/exit points.
Customizing Parameters: The standard 12-26-9 settings are a starting point. Experimenting with different EMA lengths can tailor the MACD to specific markets or trading styles.
Limitations of MACD:
False Signals: Crossovers and divergences don't guarantee a trend change. They can be false signals, especially in volatile markets.
Lagging Indicator: The MACD is based on historical price data, so it inherently lags behind current price movements.
Not a Standalone Tool: The MACD should be used in conjunction with other technical indicators and fundamental analysis for a comprehensive trading approach.
Further Exploration:
Learning about the MACD goes beyond just memorizing its components. Backtesting the MACD with historical data for specific assets can help you understand its effectiveness in various market conditions and identify optimal settings for your trading strategy. Remember, the MACD is a powerful tool, but it's not a crystal ball. Always practice proper risk management and combine it with other analytical techniques for informed trading decisions.
Disclaimer: The information contained in this blog post is for educational purposes only and should not be construed as financial advice. Trading financial instruments involves substantial risk and can result in significant financial losses. Before making any trading decisions, it is essential to conduct your own research and consider seeking the advice of a qualified financial professional.