
The Evolution of Trading Strategies: Integrating Multiple Timeframe Analysis for Enhanced Performance
Hello trader, welcome to my blog, where we are diving into the exciting world of trading. But don't worry if you are new into this field, I will keep things simple and easy to understand.
Trading in not just about buying and selling in stocks or Index or any other financial instruments. It is like a puzzle, where you are always trying to figure out the best move to make money. And one really cool piece of the puzzle is called "Multiple Timeframe Analysis."
Sound fancy, right? Don't worry it is not that complecated but the most important key componenet of technical analysis.
Basically it is about looking at different time period to understand the whole picture, like what shall I do right now as per the market condition. And trust me, multiple timeframe analysis is the most crucial component of mind set up game into the market.
How Many Timeframe Chart Shall I Check?
To understand the market behaviour, we shall check chart in three differents timeframe. A combination of longer term timeframe, intermidiate term timeframe and shortert erm timeframe.
We check longer term time frame to understand the big picture or market trend. This longer term time frame help us to decide whether we shall be buyer in the market or we shall be seller, if my loner term timeframe is up, then I will always wait to buy on correction or upon any other buying opportunity and vise versa.
We check intermediate term timeframe to decide around what price we can buy or sell as per the trend.
We check Shorterterm timeframe to indentify more purified entry, so that we can minimize our risk and maximize our reward.

Multiple Timeframe Combination
To understand the market scenario I personally use different timeframe combinations for different types of trade. Here are my combinations below.
1) Quarterly Chart - Monthly Chart - Weekly Chart
2) Monthly Chart - Weekly Chart - Daily Chart
3) Weekly Chart - Daily Chart - Hourly chart
Above three timeframes are more than enough to understand what shall I do right now.
Which Combination Is Perfect For Current Market Scenario?
This is the most important question for every trader. What I feel, we shall not chose the combination ourselves, instead, we shall read the market, what it is trying to say us. Remember market is the "King" and shall obey the king's direction.
What I do, When price in in official up trend, approaching 52 weeks high or making life time high, normally I enter in to a long trade as per only hourly buying opportunity, it may be hourly trend line break out or hourly demand zone.
When price start making lower high and lower low in hourly chart for the first time, then I not enter into a long trade based on hourly chart and I do prefer to enter into a daily demand zone.
When Hourly chart starts making lower low normally no buying in hourly chart will be good, my personal experience in last 21 years in stock market field is, when hourly chart start making lower low then normally price approach Daily demand zone or any daily buying opportunity only sustains.
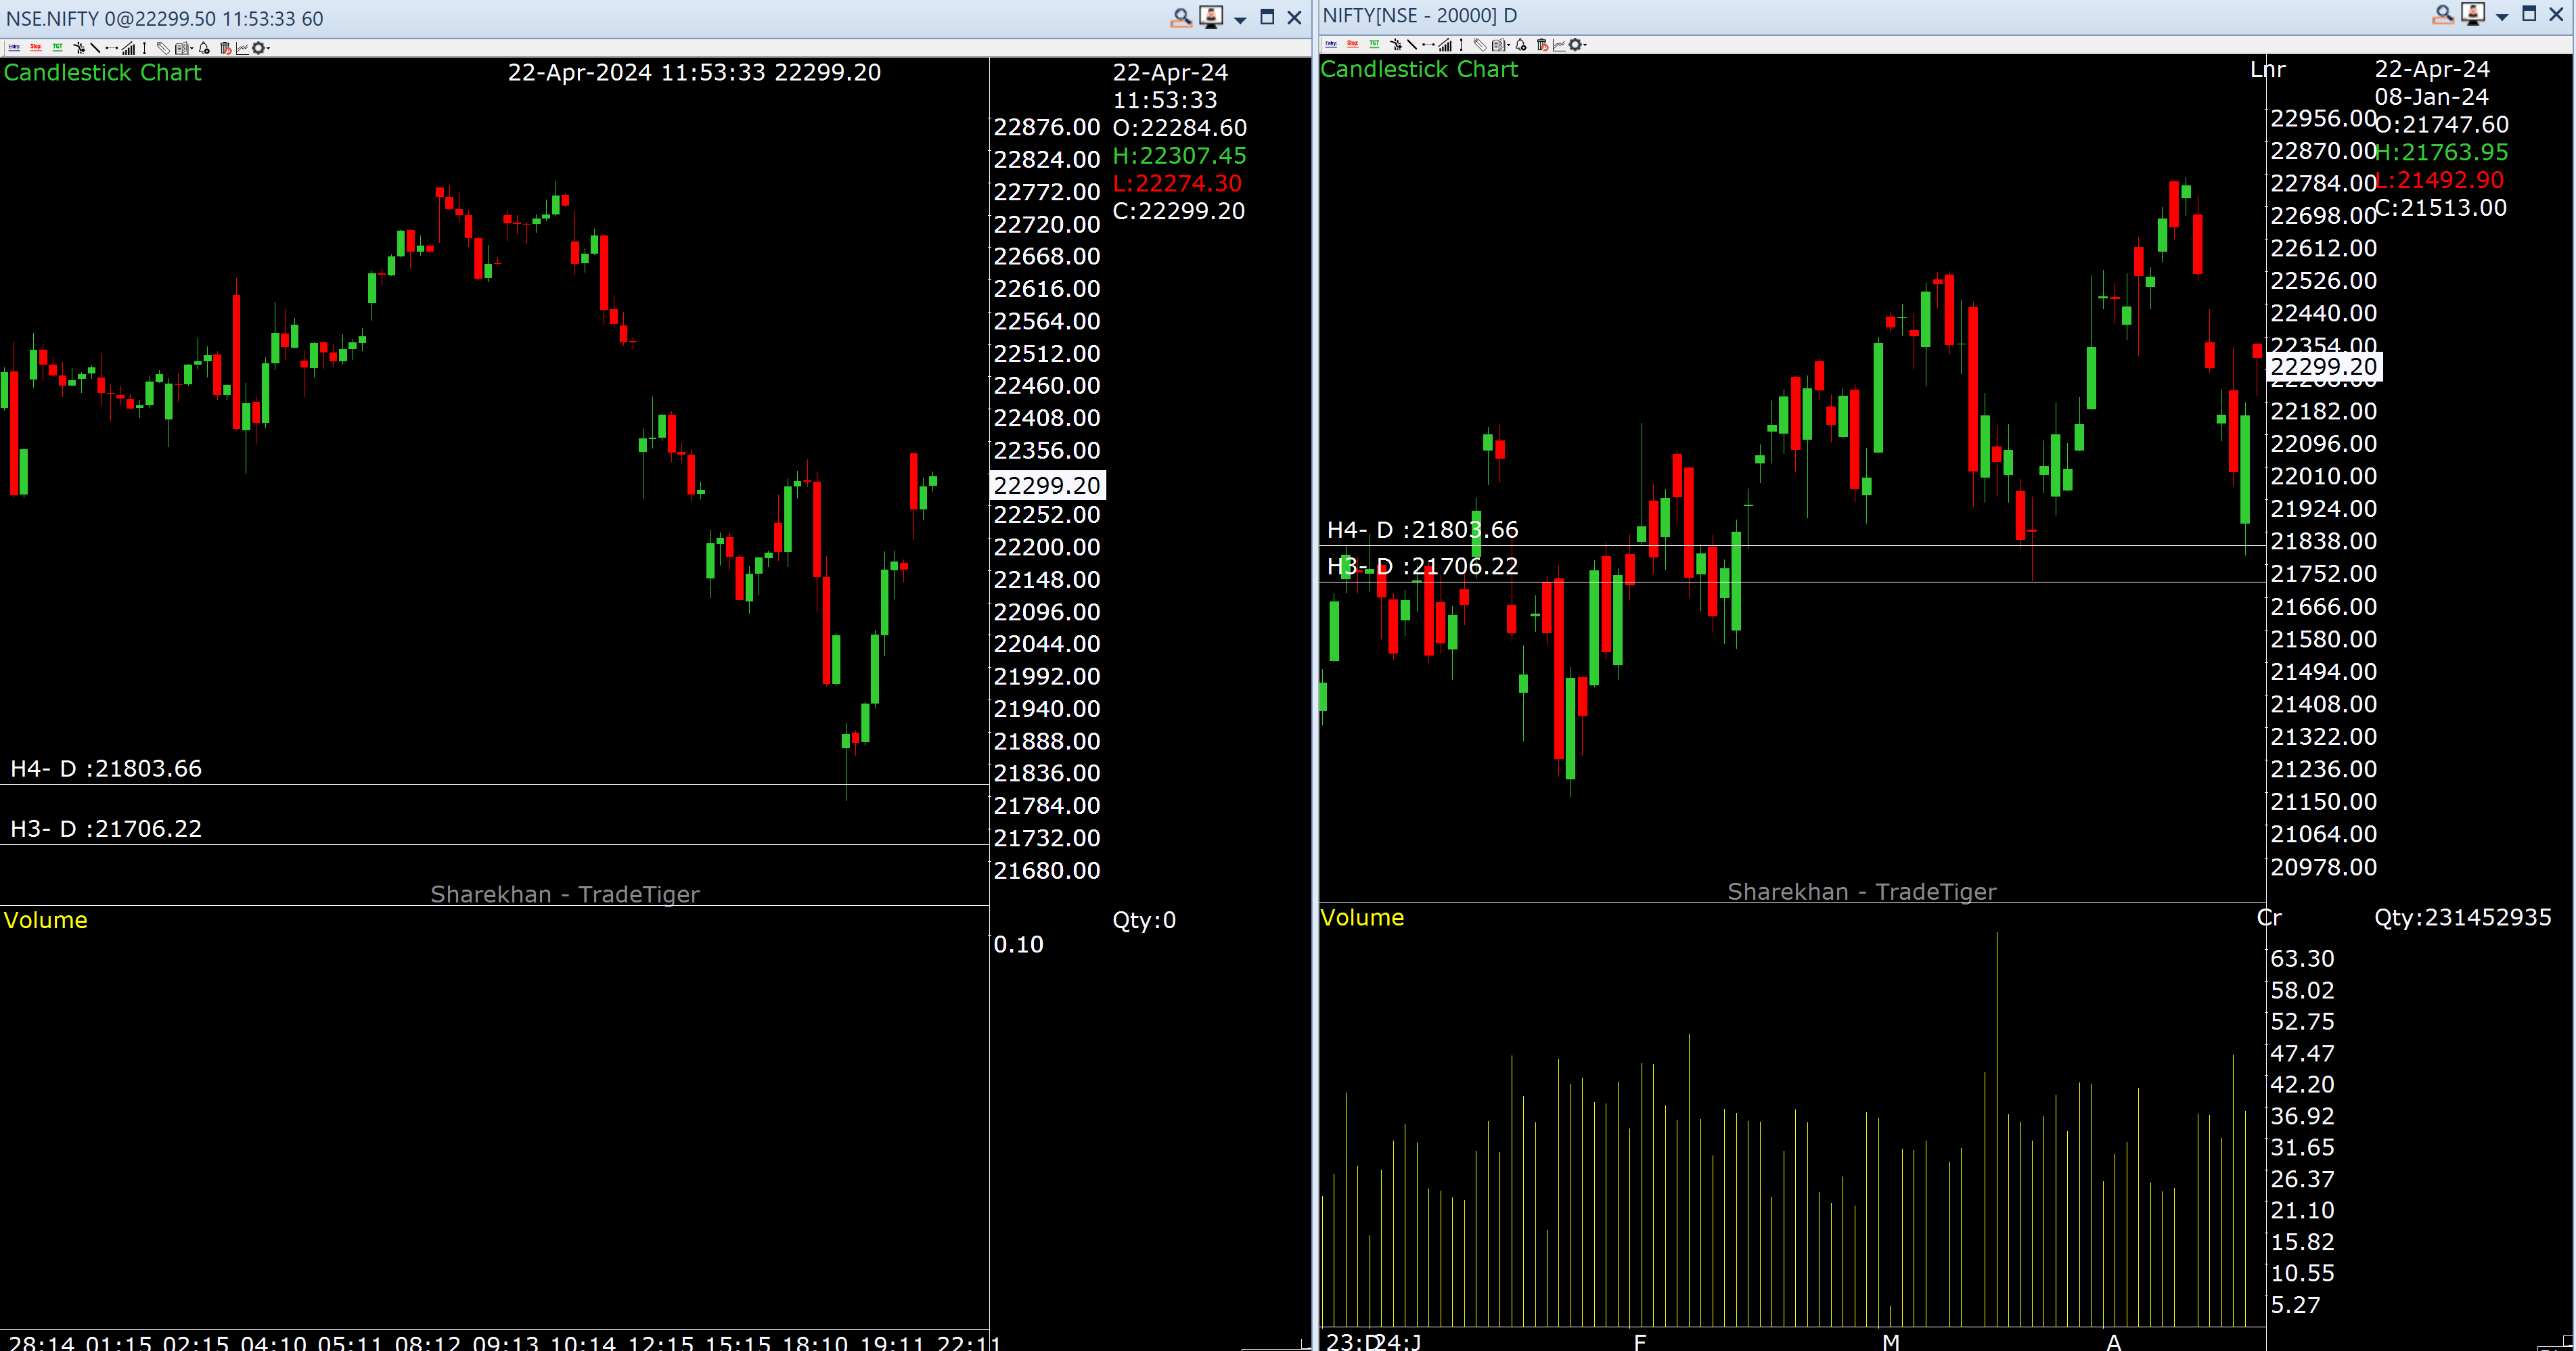
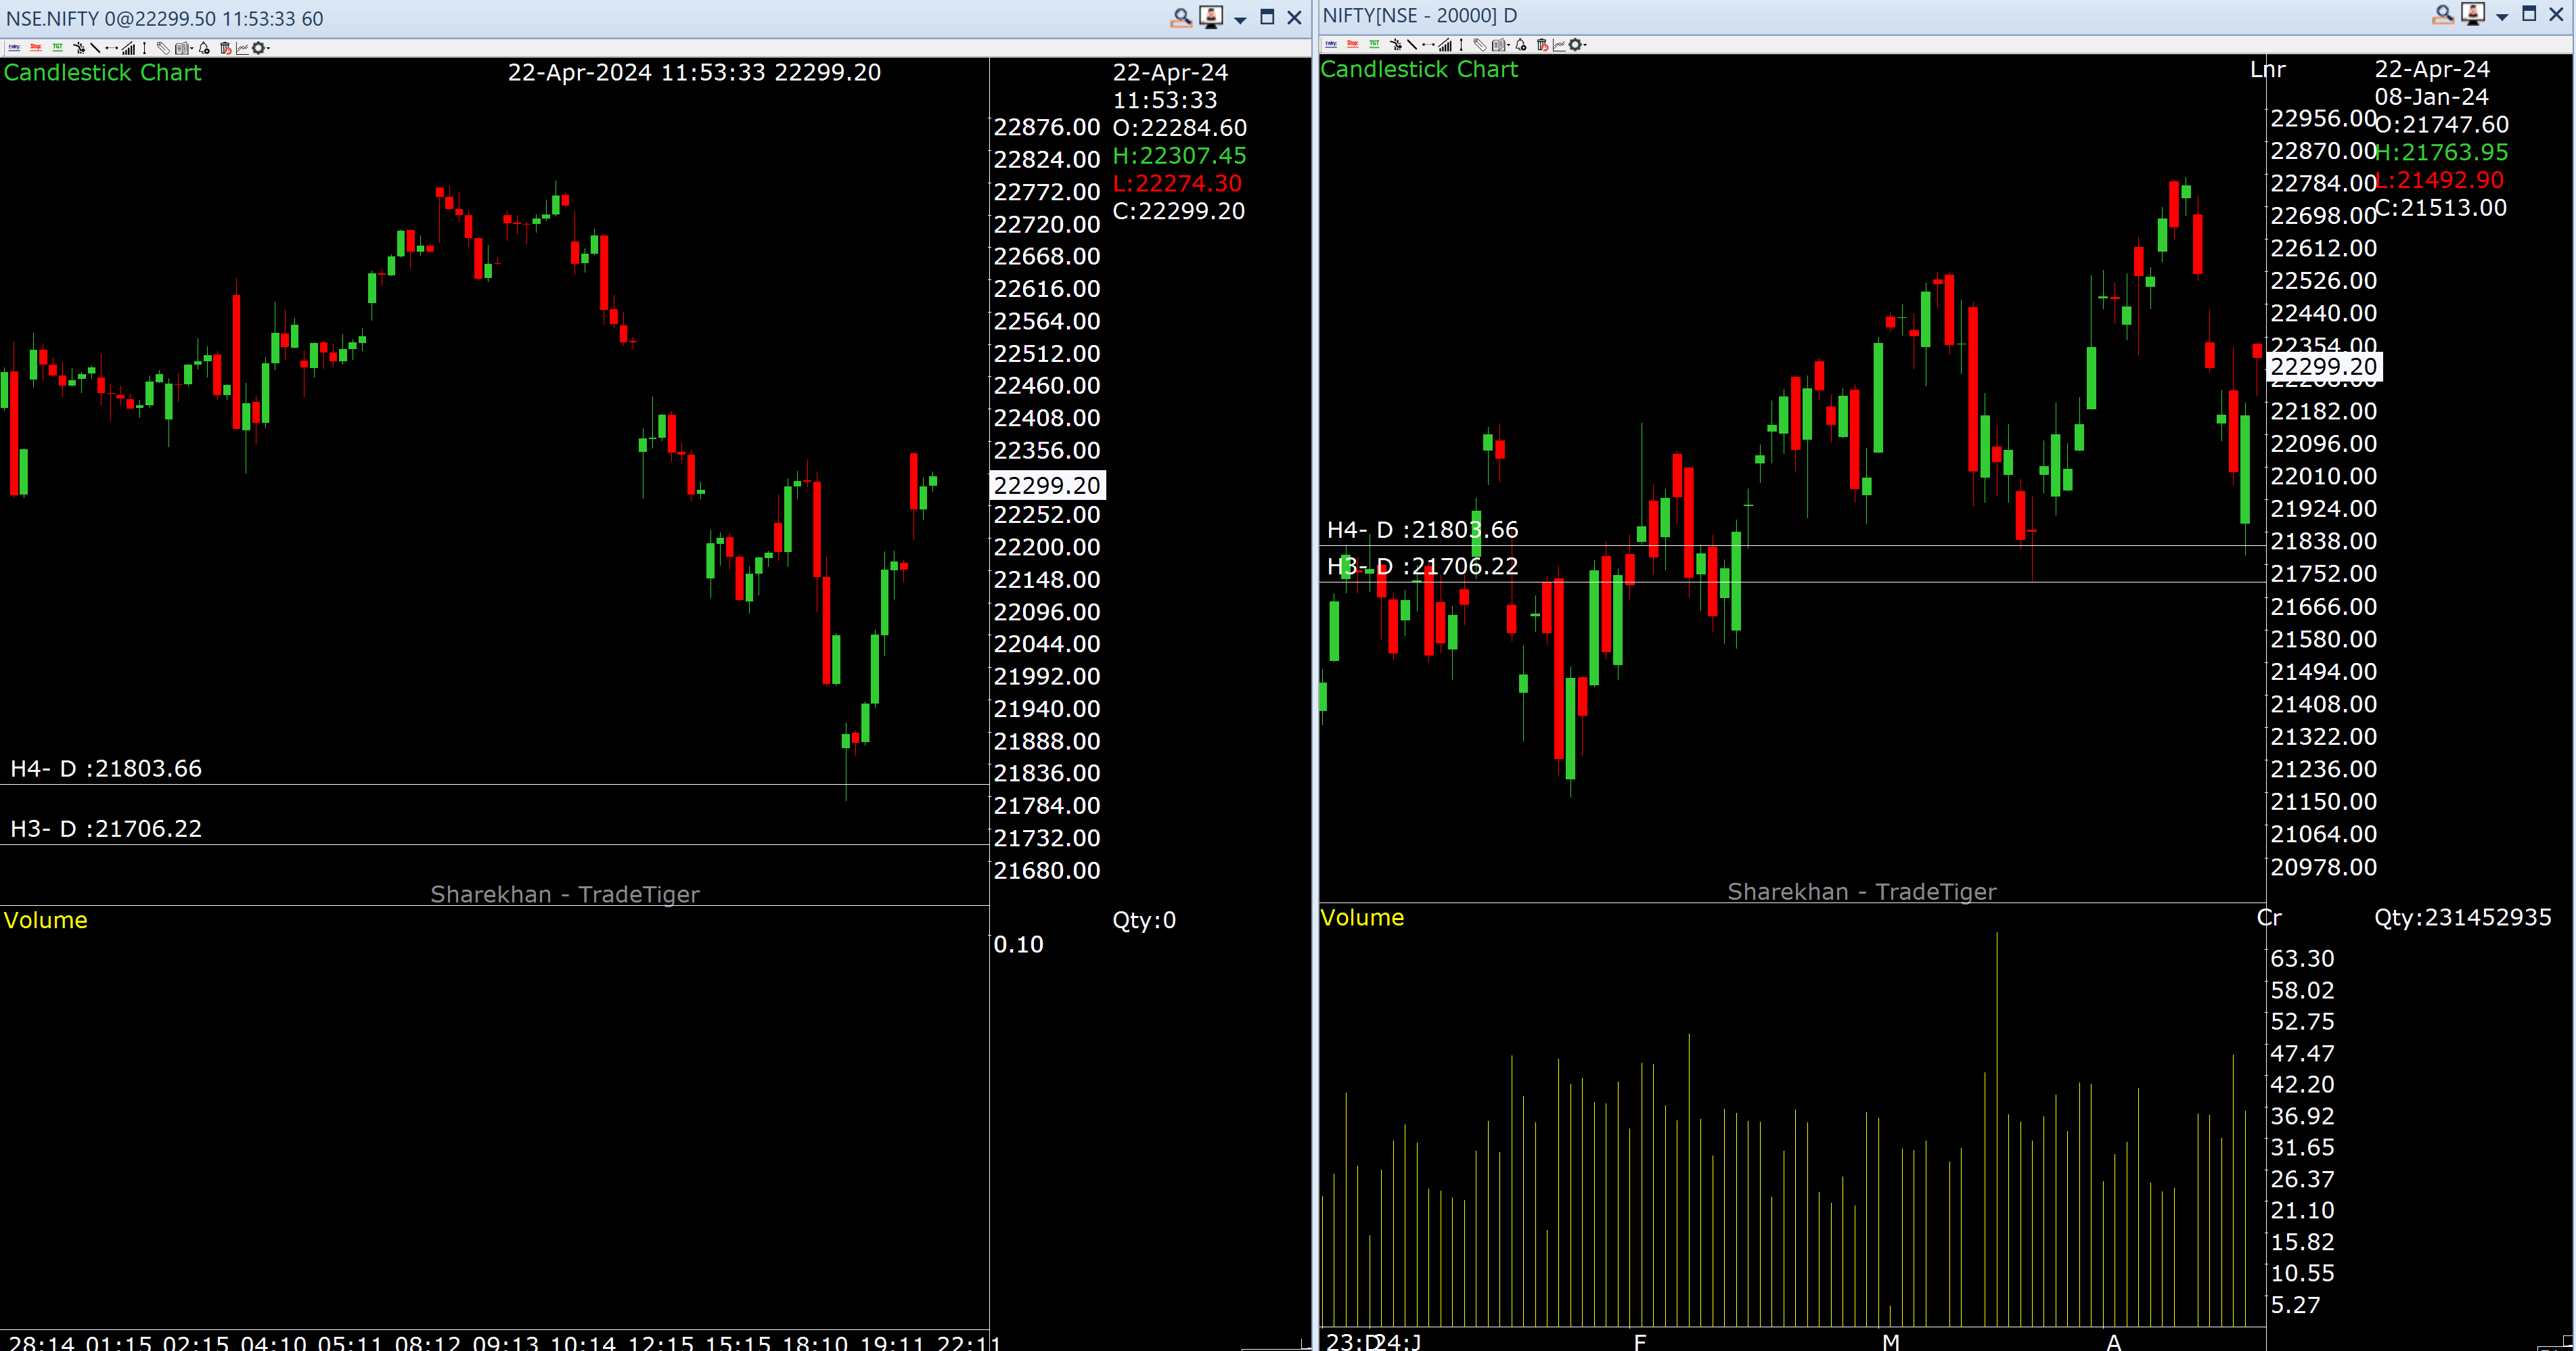
See the picture right side, Nifty has made a life high on 10th Apr 2024 then then it has started correcting. In hourly chart, it has made first lower high and lower low on 12th Apr 2024 and it was very clear on that day, that Nifty will arrive its daily demand range 21710 to 21930.
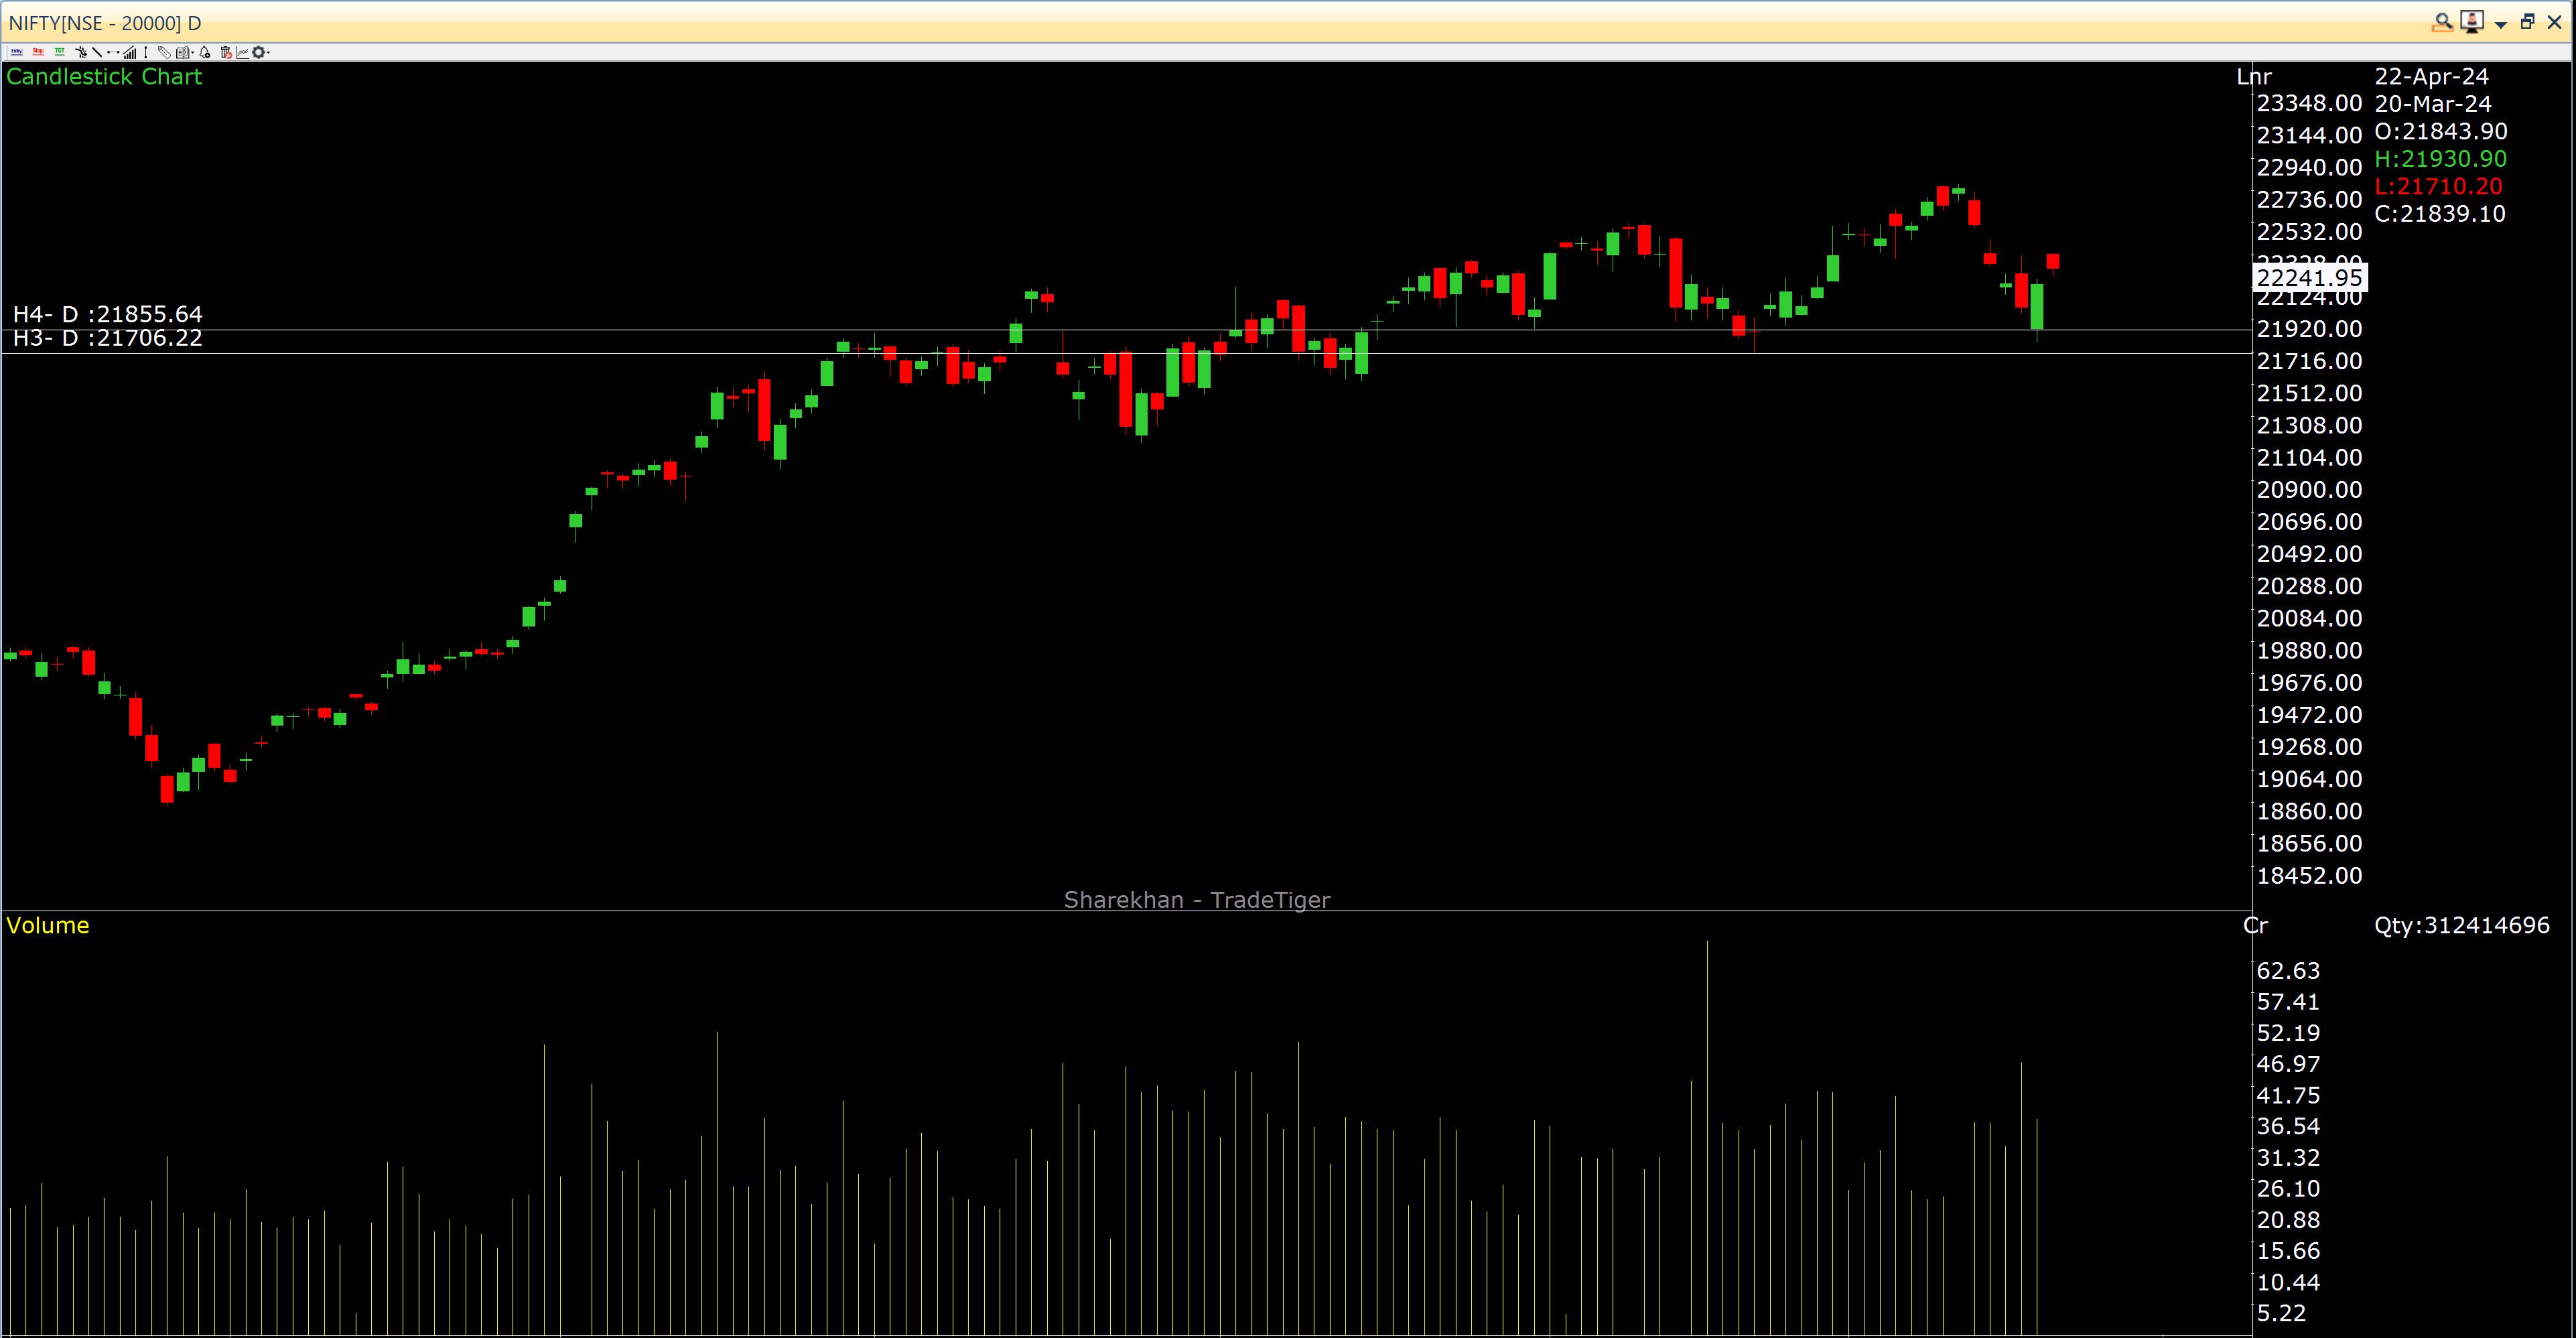
Now if you convert the chart into hourly for more purified entry, then convert the chart into hourly and you will see hourly demand is available at 21710 to 21801.
Nifty has made a low of 21777 on 19 Apr 2024 and now trading at 22292 on 2nd Apr almost 500 points up from the demand.
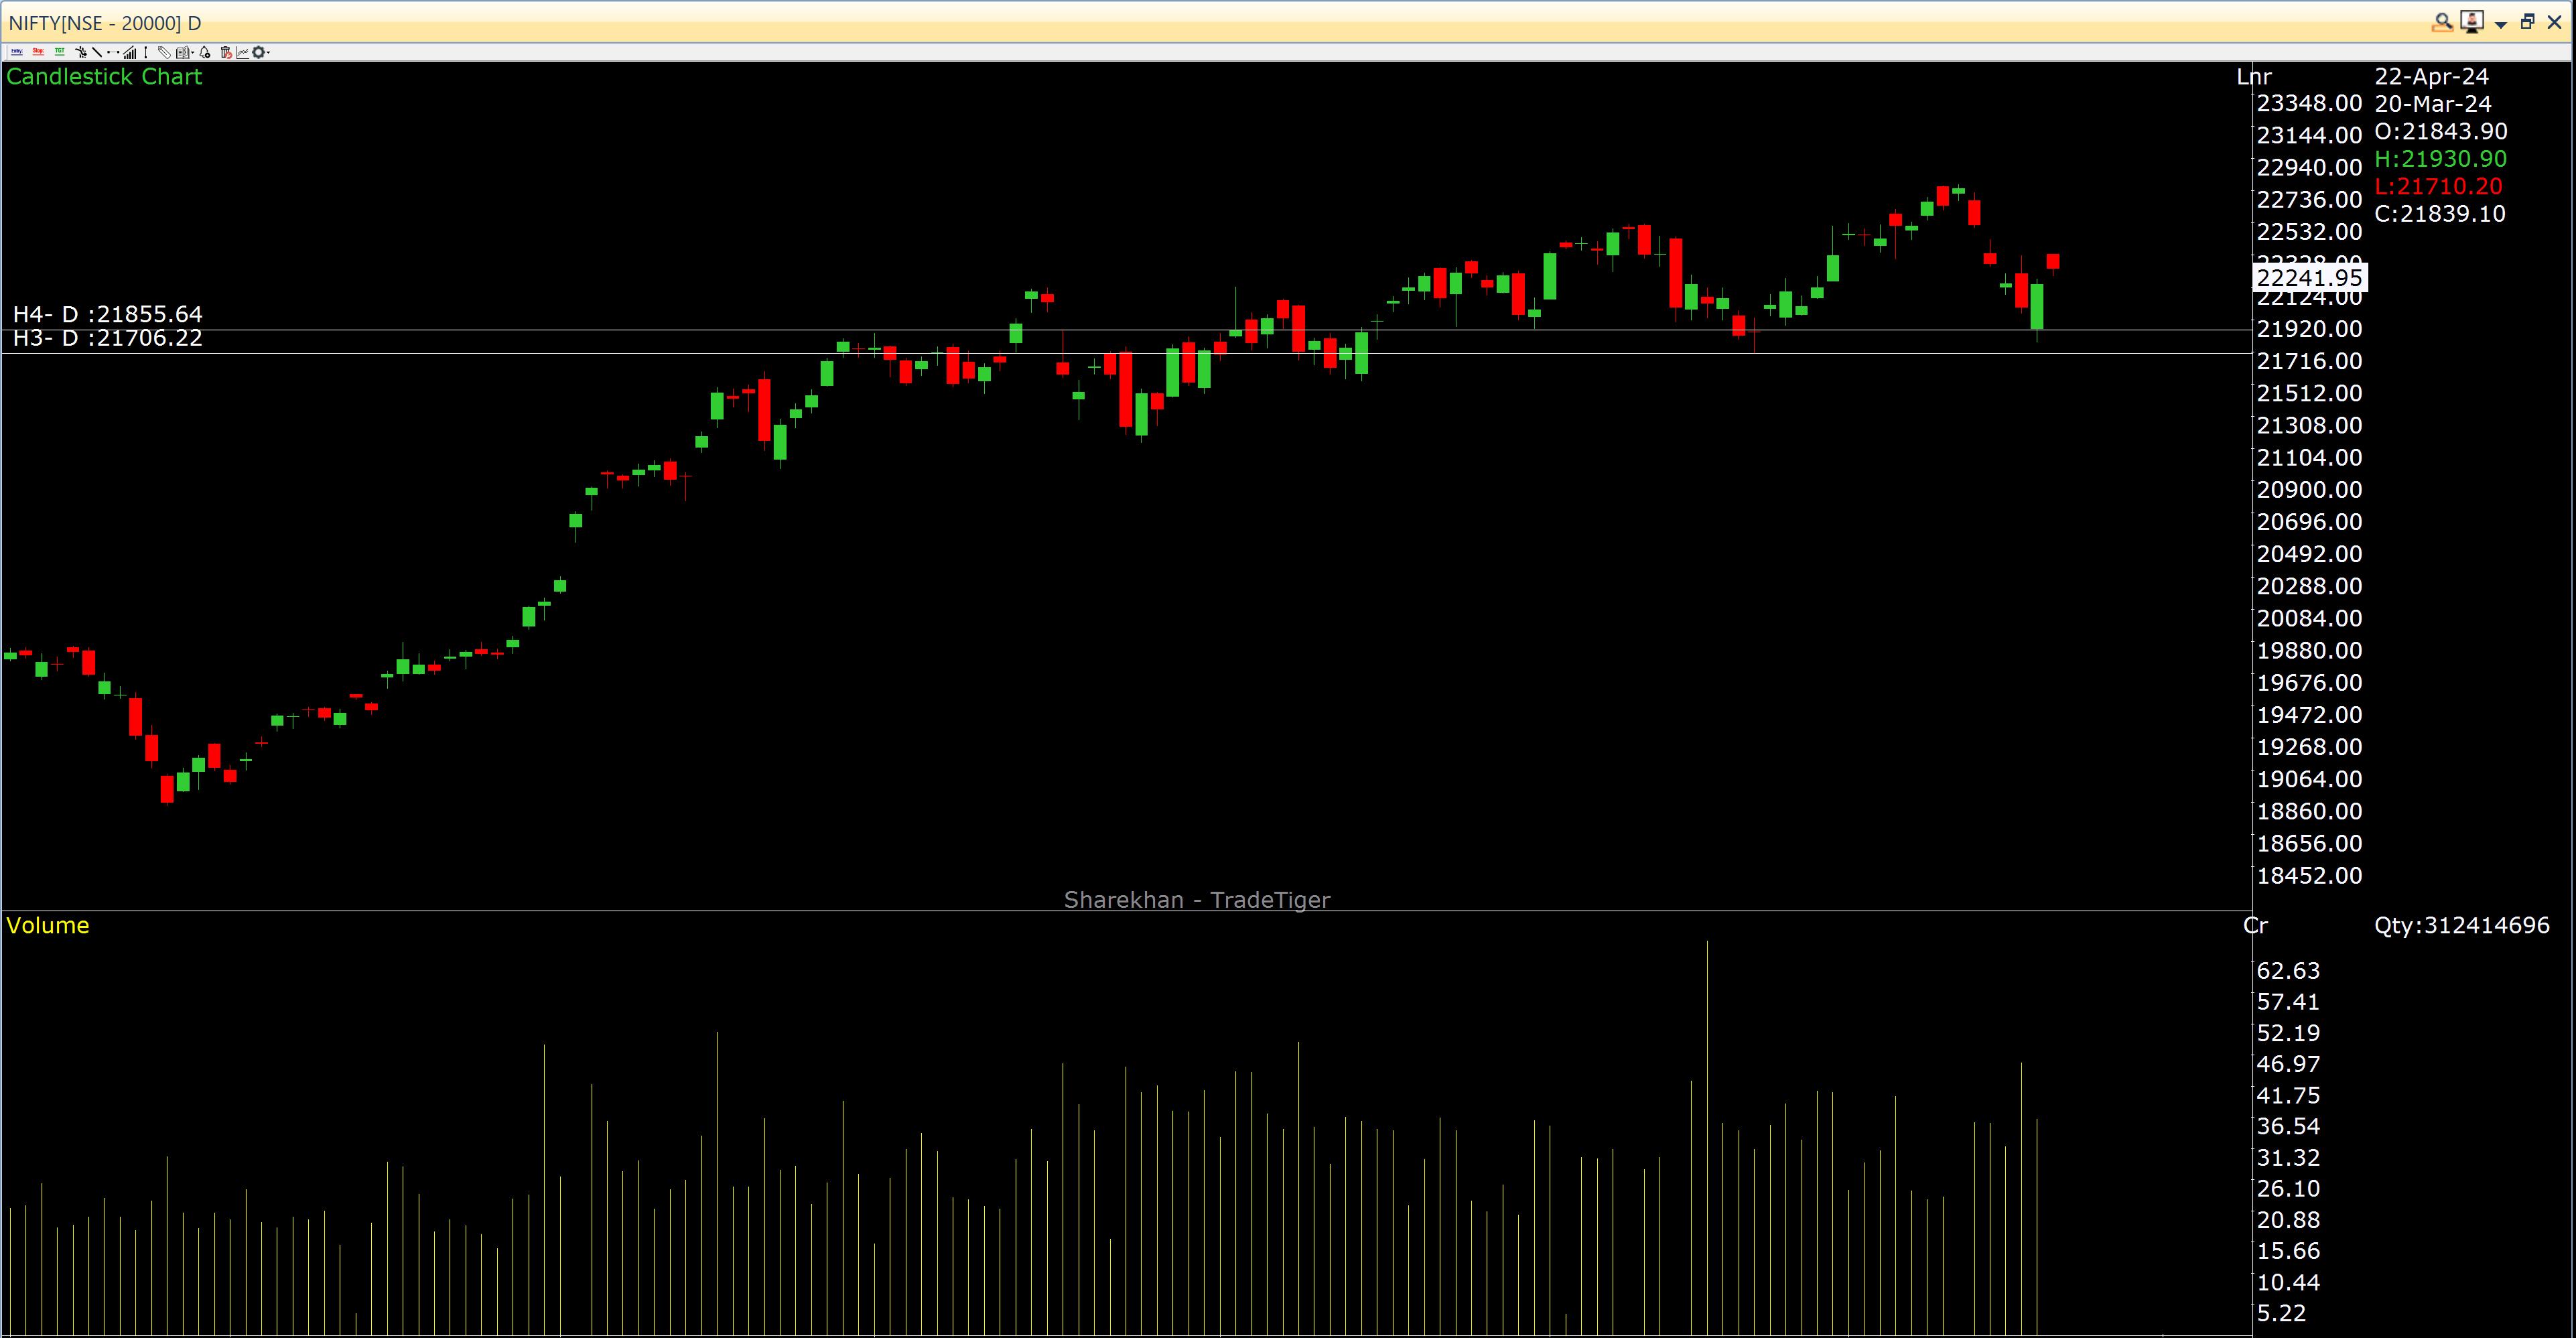
Nifty daily demand 21710 to 21930
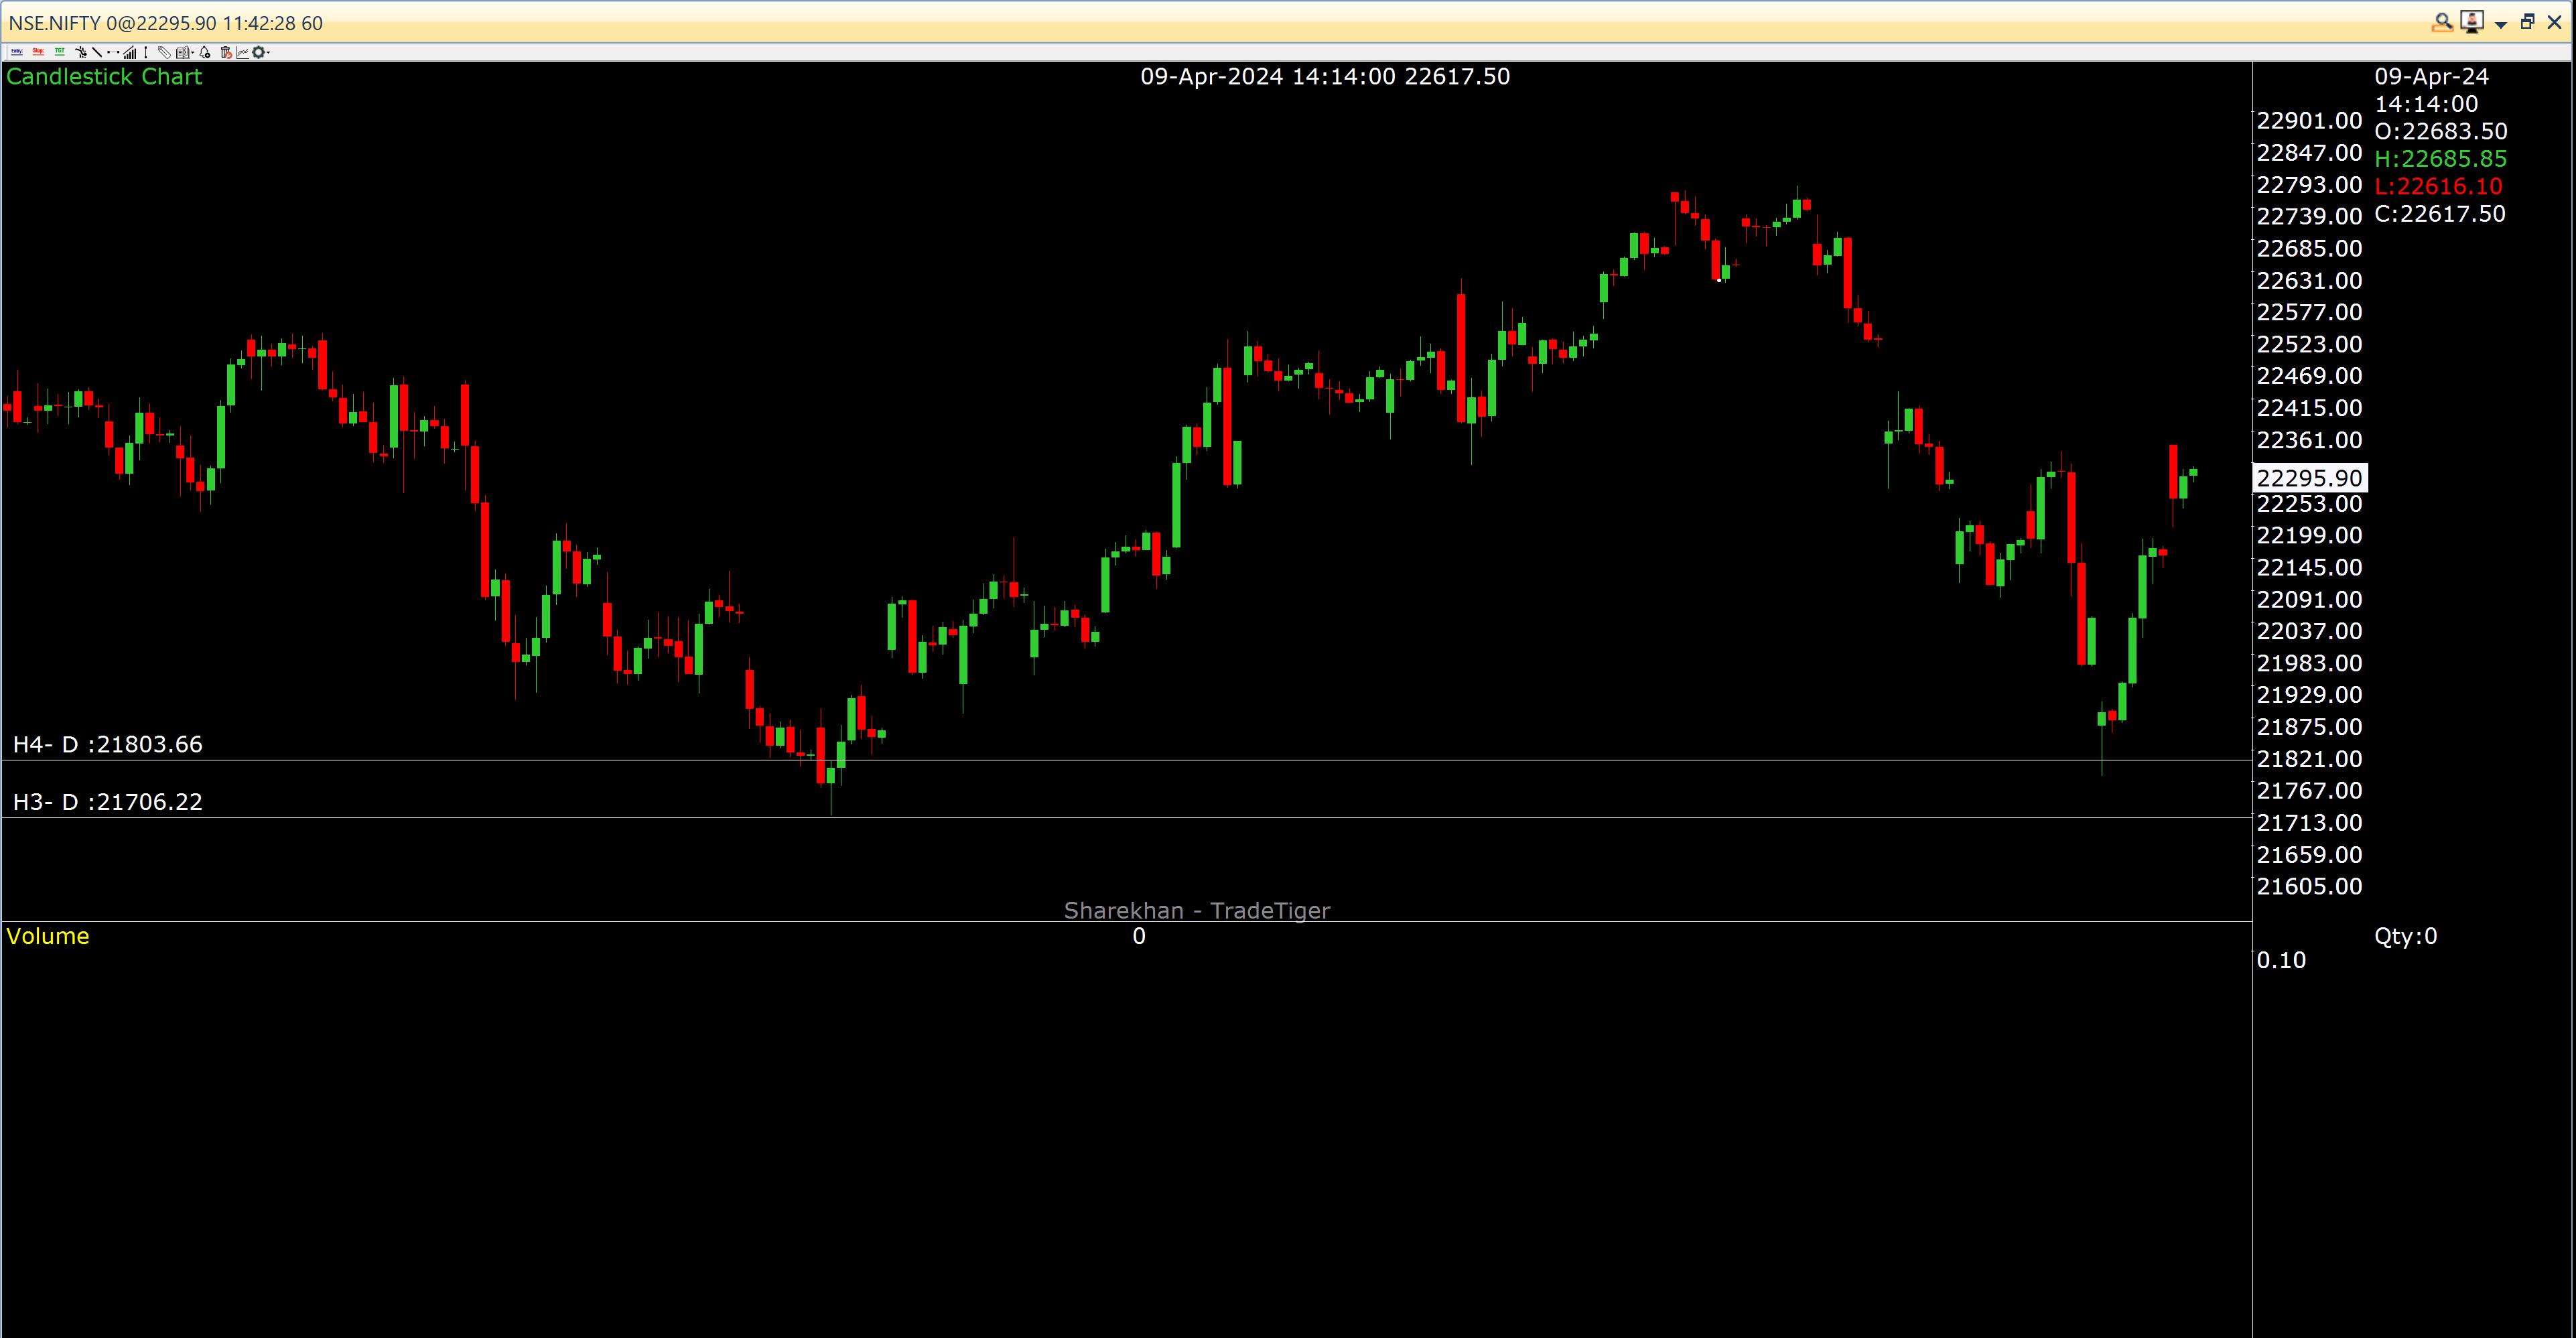
Nifty hourly demand at 21710 to 21801
When To Use Weekly or Monthly Demand Zone?
In previous example I have told you, if price coming down and making lower low and lower high in hourly chart then it will obviously come down t daily demand.
The rule is, check the chart in which time frame price making lower high and lower low, and then use higher time frame demand zone of that time frame.
More elaborately, if Hourly chart making lower high and lower low then use daily demand zone.
If Daily chart making lower high and lower low then use weekly demand zone.
If weekly chart making lower low and lower high then use Monthly demand zone.
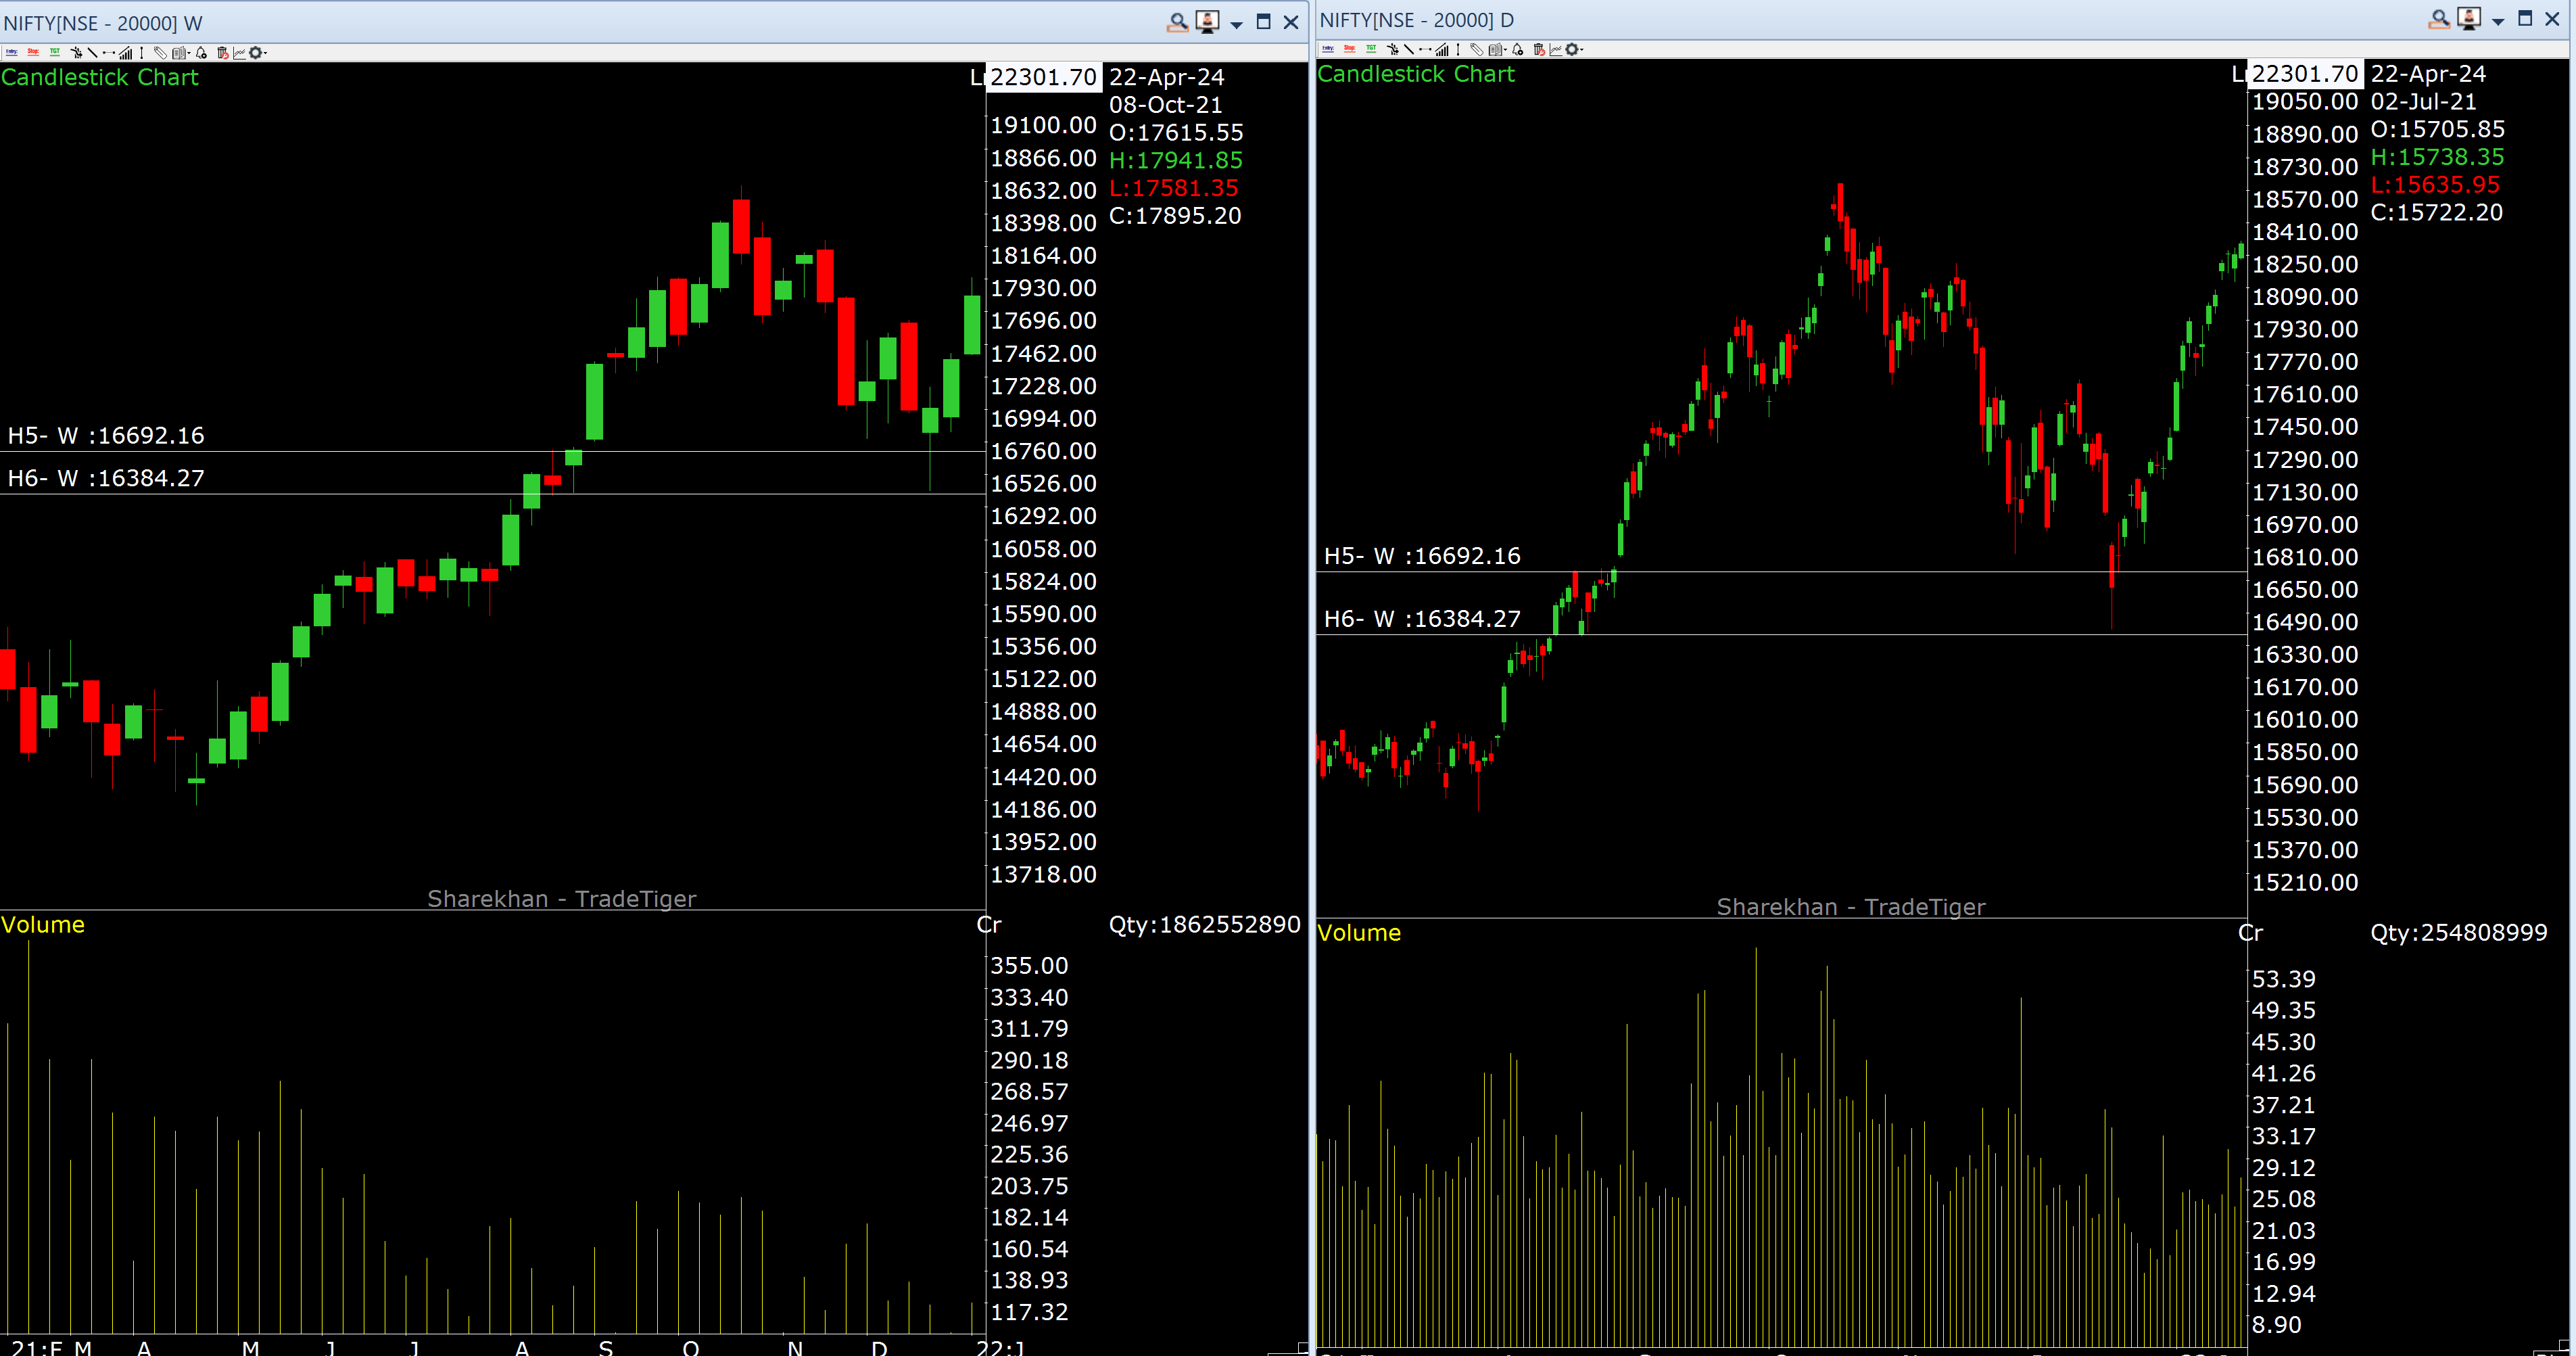
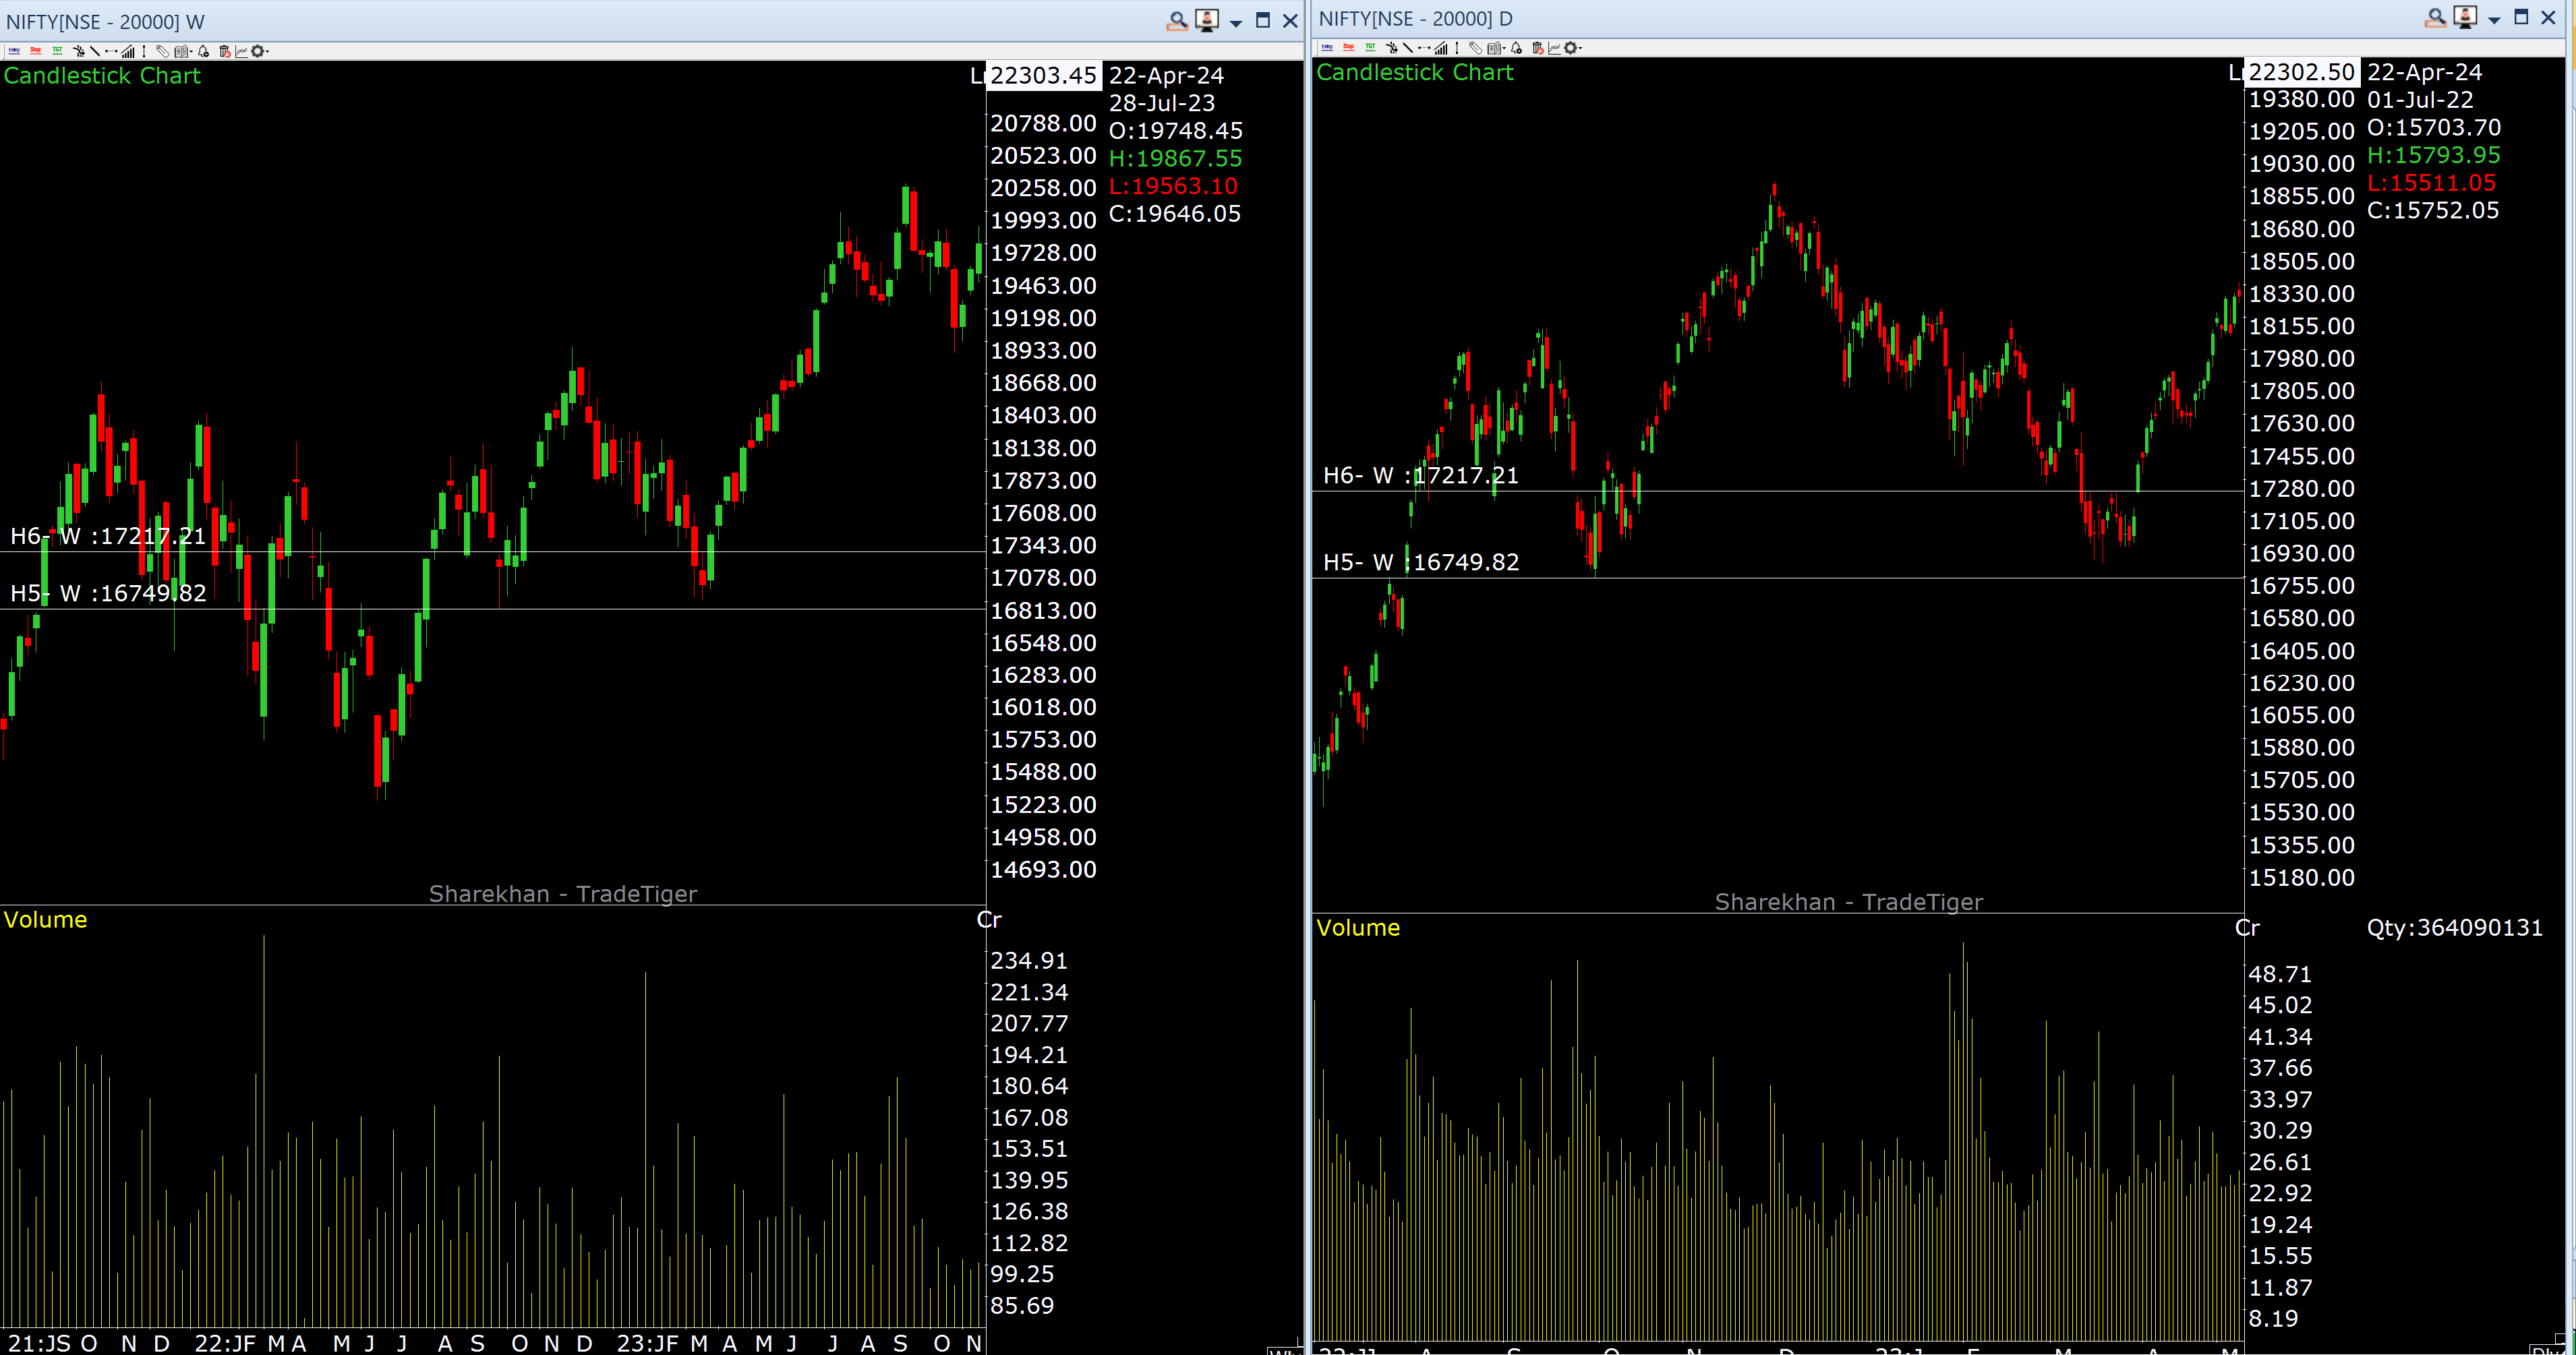
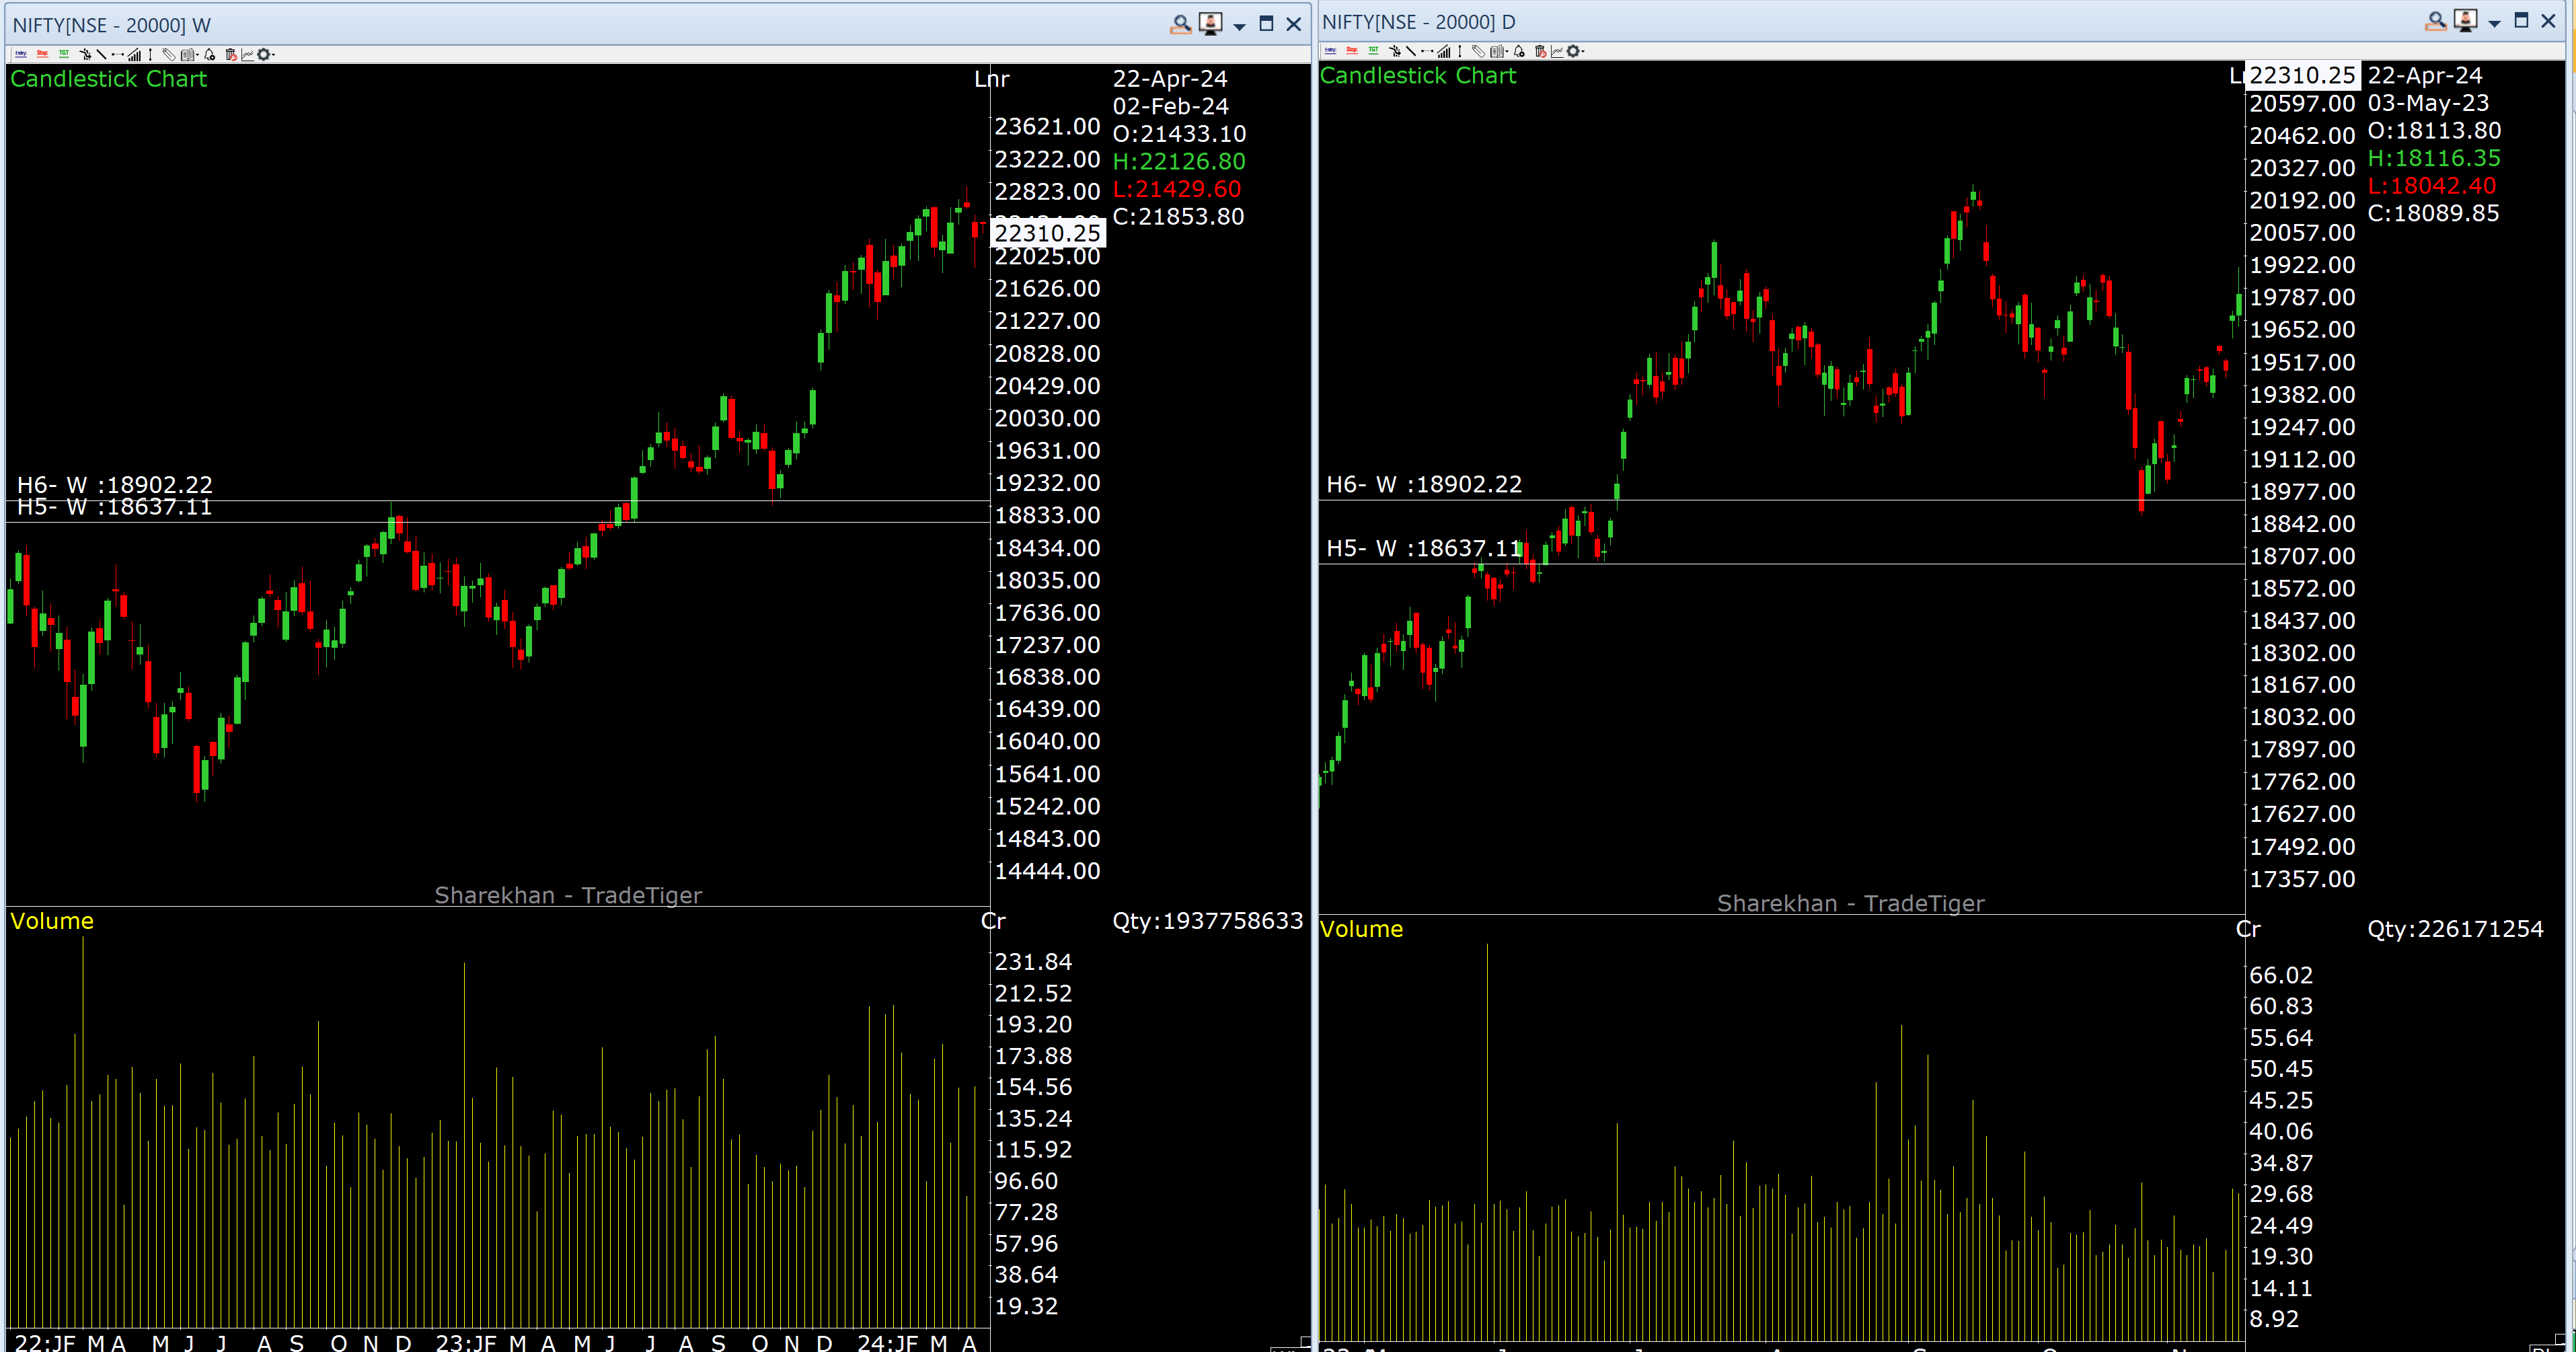
Check the below Image slider, here I have given examples of the rule in Nifty of last 10 years